Data Navigator
UX Design Lead — AI-First Data Discovery Platform
Data Navigator is FactSet's platform for discovering, evaluating, and accessing financial data products. It serves data consumers — analysts, engineers, and operations teams — who need to find the right dataset, understand its coverage, and get it into their workflow quickly.
UX Design Lead embedded in the product team. I own key parts of the product experience, partner with PMs to stay ahead on AI capabilities, and collaborate directly with engineering leads and PDs to ship production-ready work.
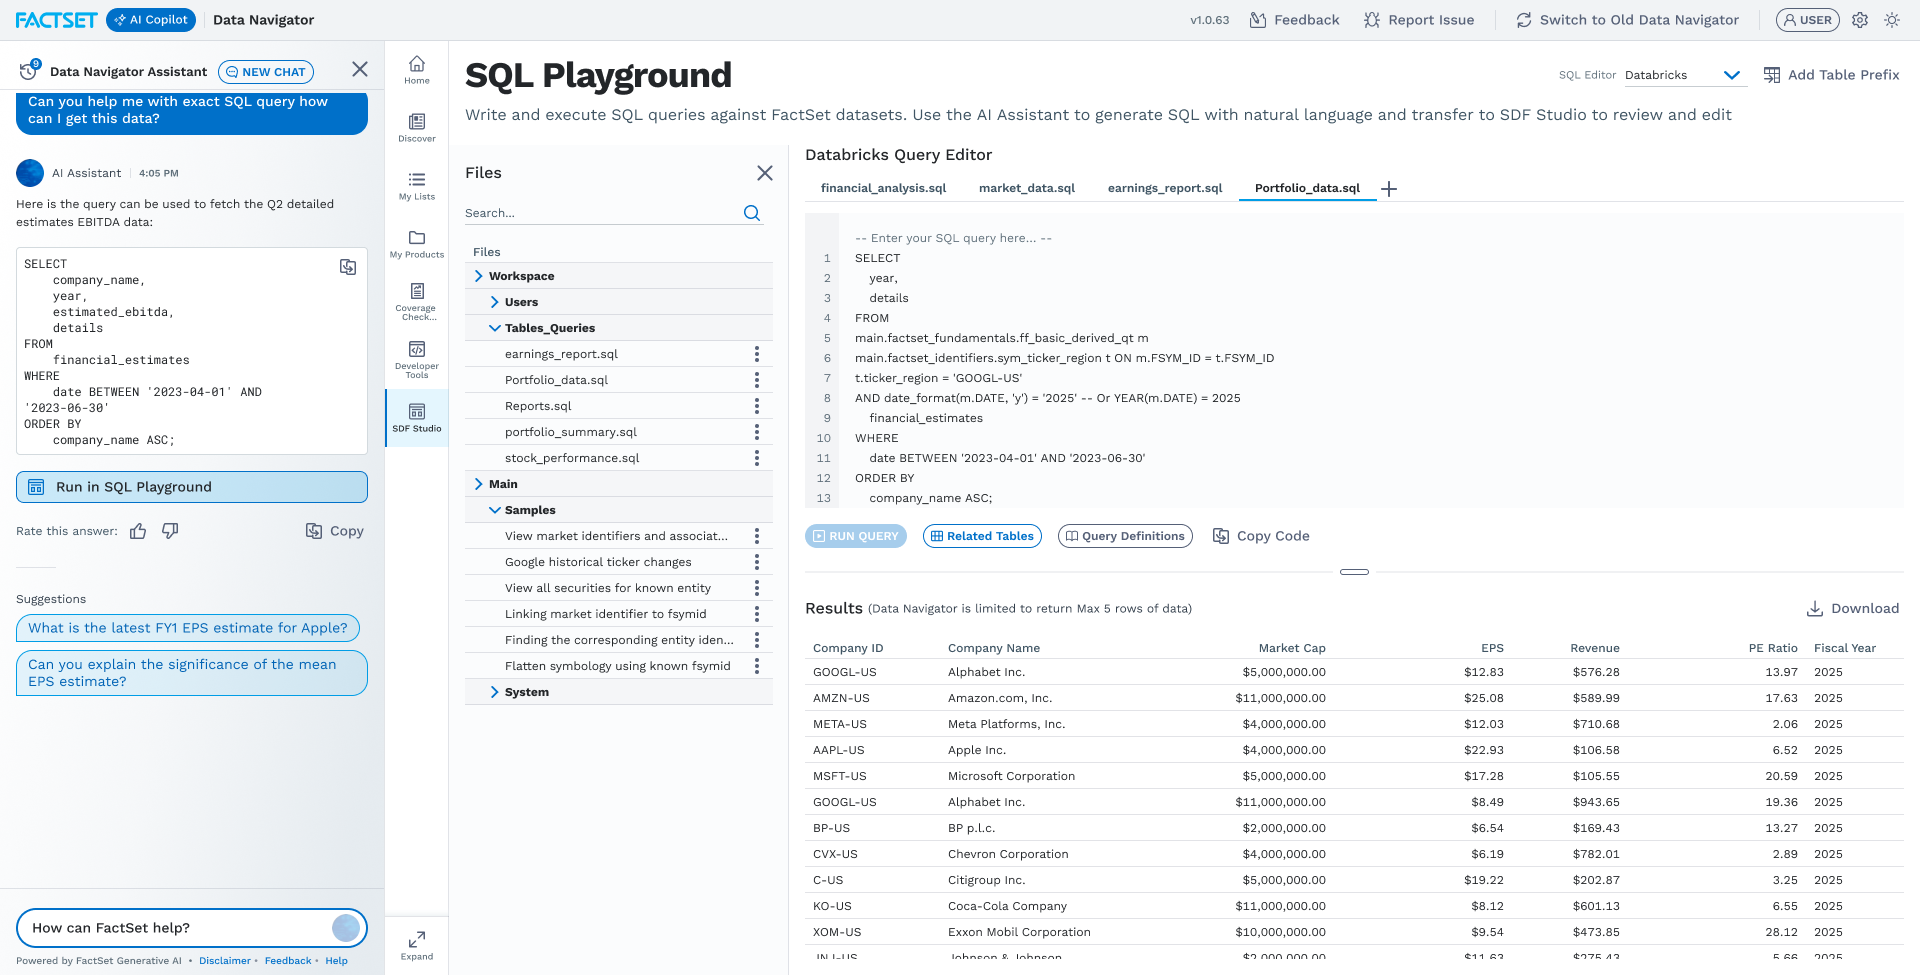
The SQL Editor is one of the most critical workflows in Data Navigator — users run queries directly against FactSet data to validate coverage, test schemas, and confirm how data is being delivered before committing to a dataset. I ideated the experience and prototyped and built it using Figma Make, enabling engineers to ship it faster with a production-quality reference.
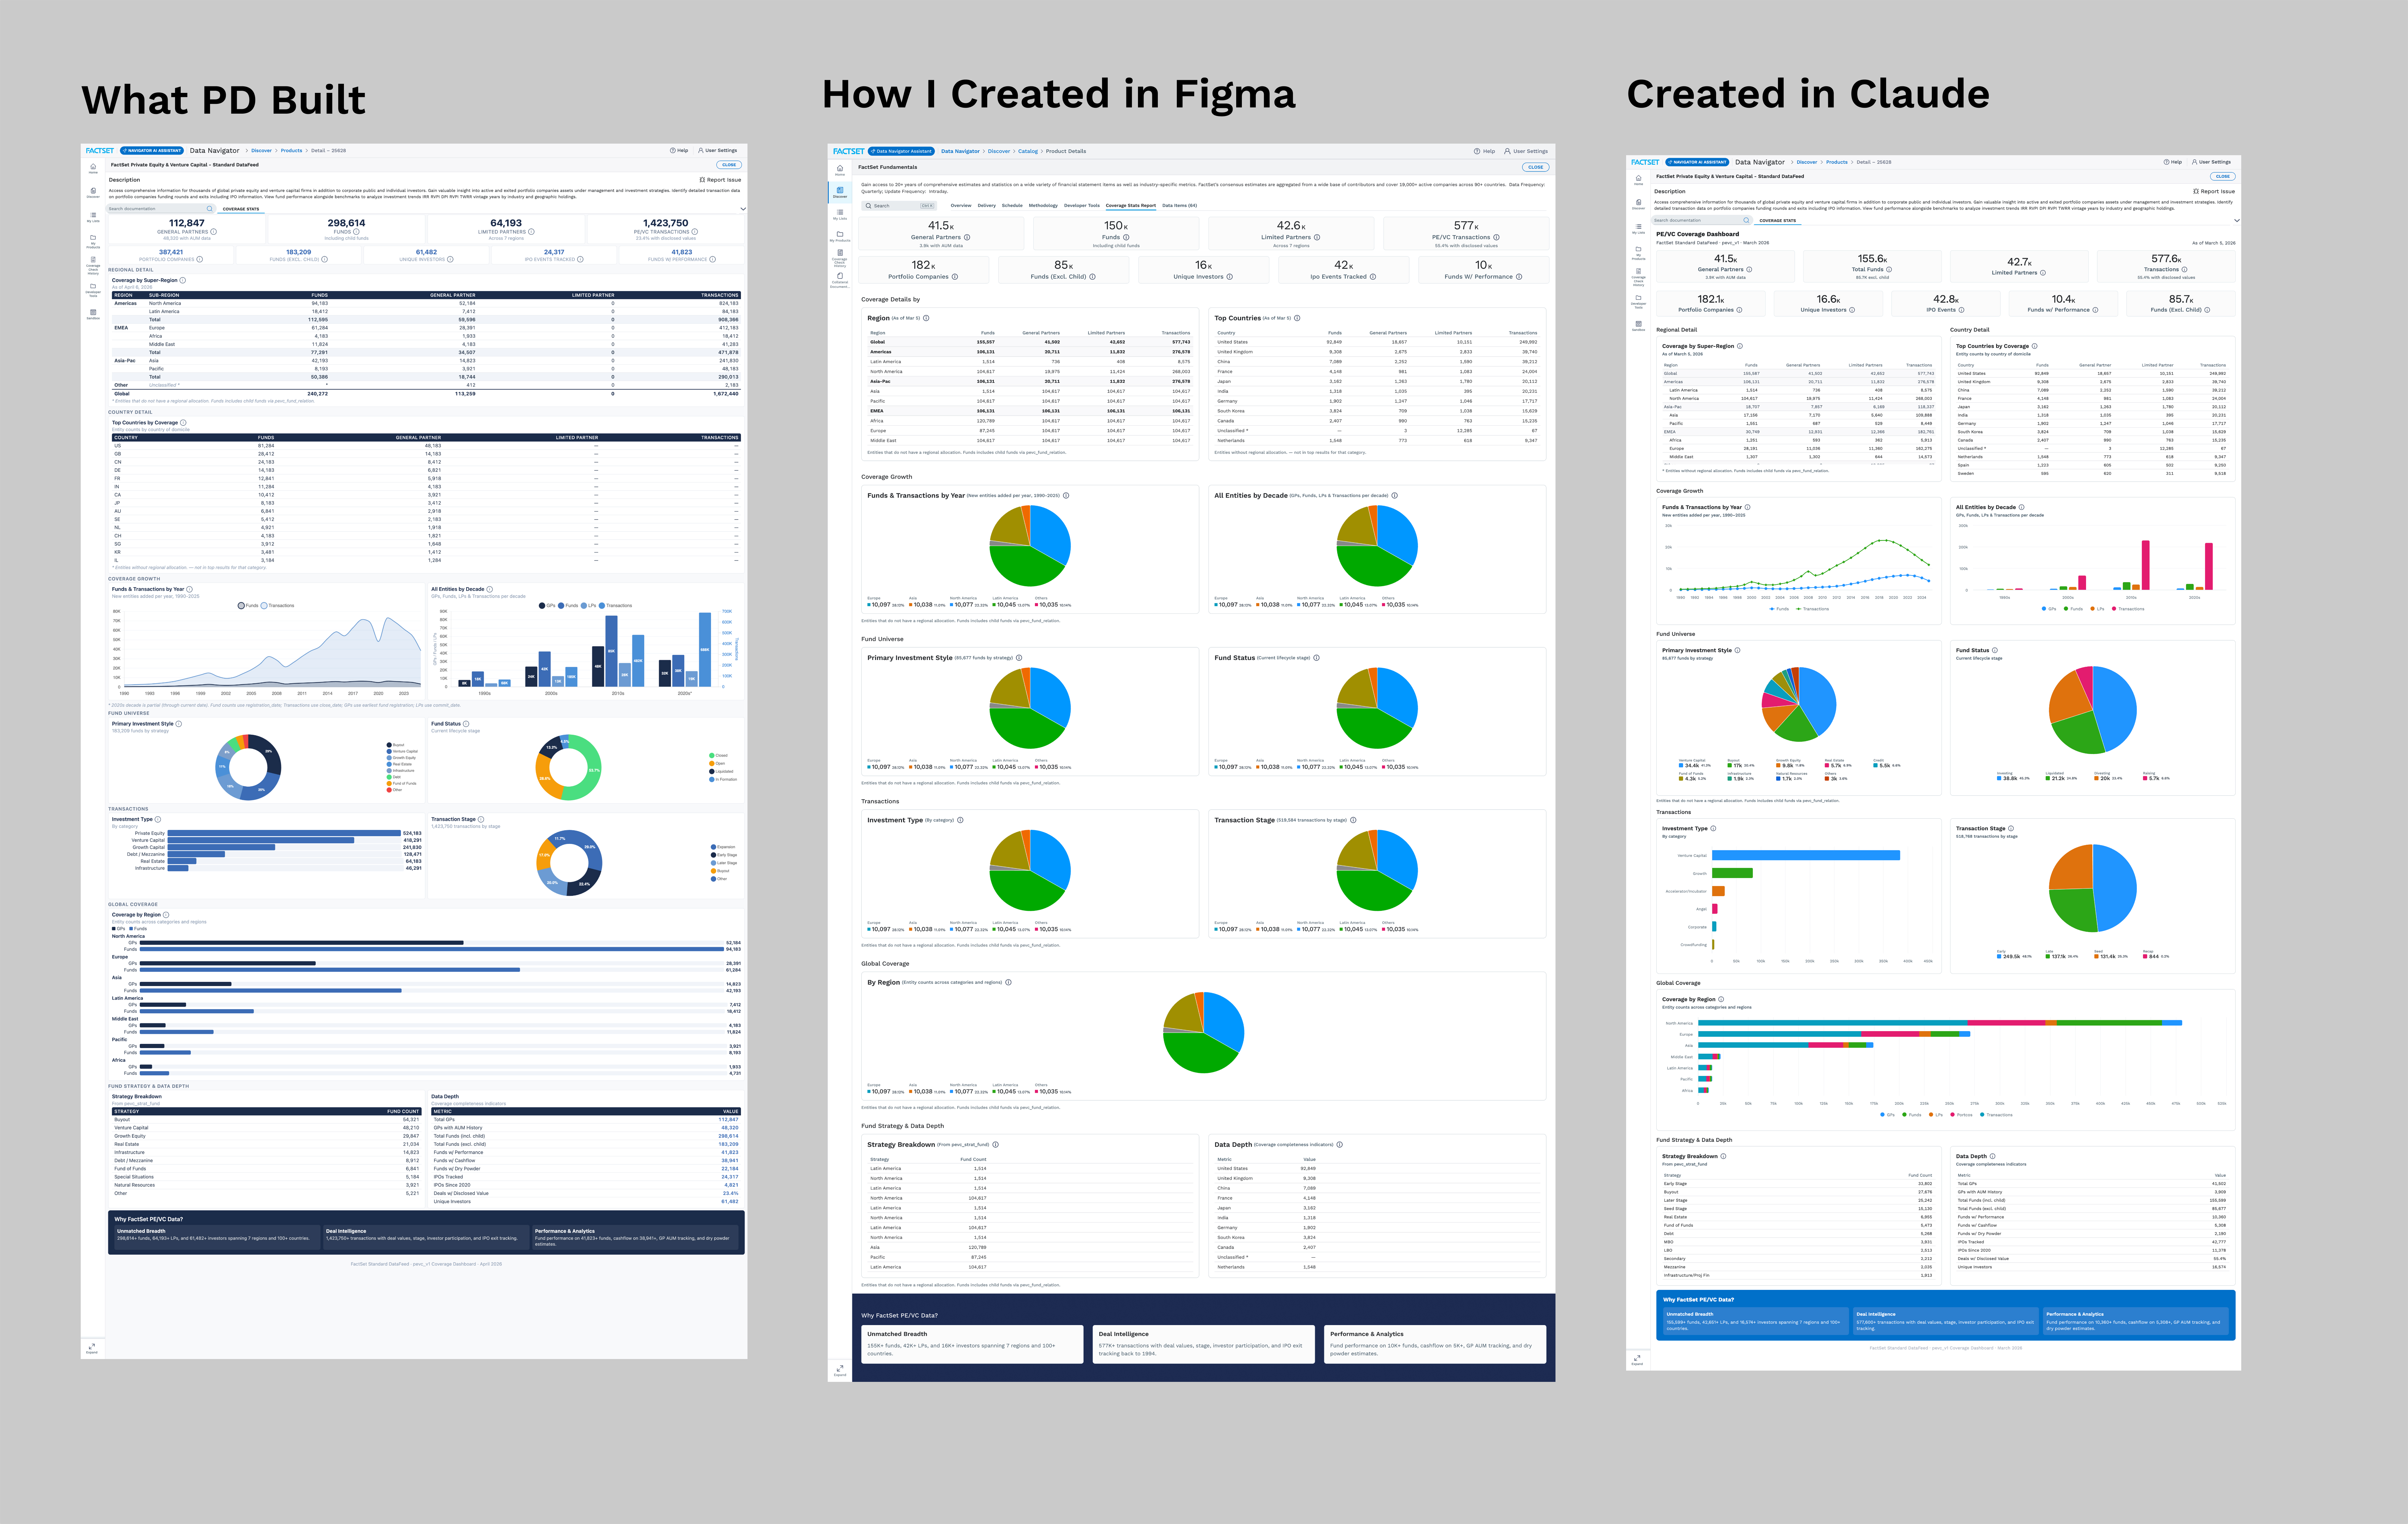
The Product Directors had built a Coverage Stats view that showed clear value but didn't follow any design guidelines. Rather than producing another static mockup, I redesigned it with Figma Make and Claude, delivering production-ready code in a single day — aligned to the Fusion Design System. The engineering team was able to ship it directly without rework.
The Dashboard was built using a Spec Driven workflow with Claude — writing structured requirements specs first, then using them to drive code generation. This approach significantly reduced hallucinations and kept the output tightly aligned to real product requirements. The dashboard was delivered in under a week.
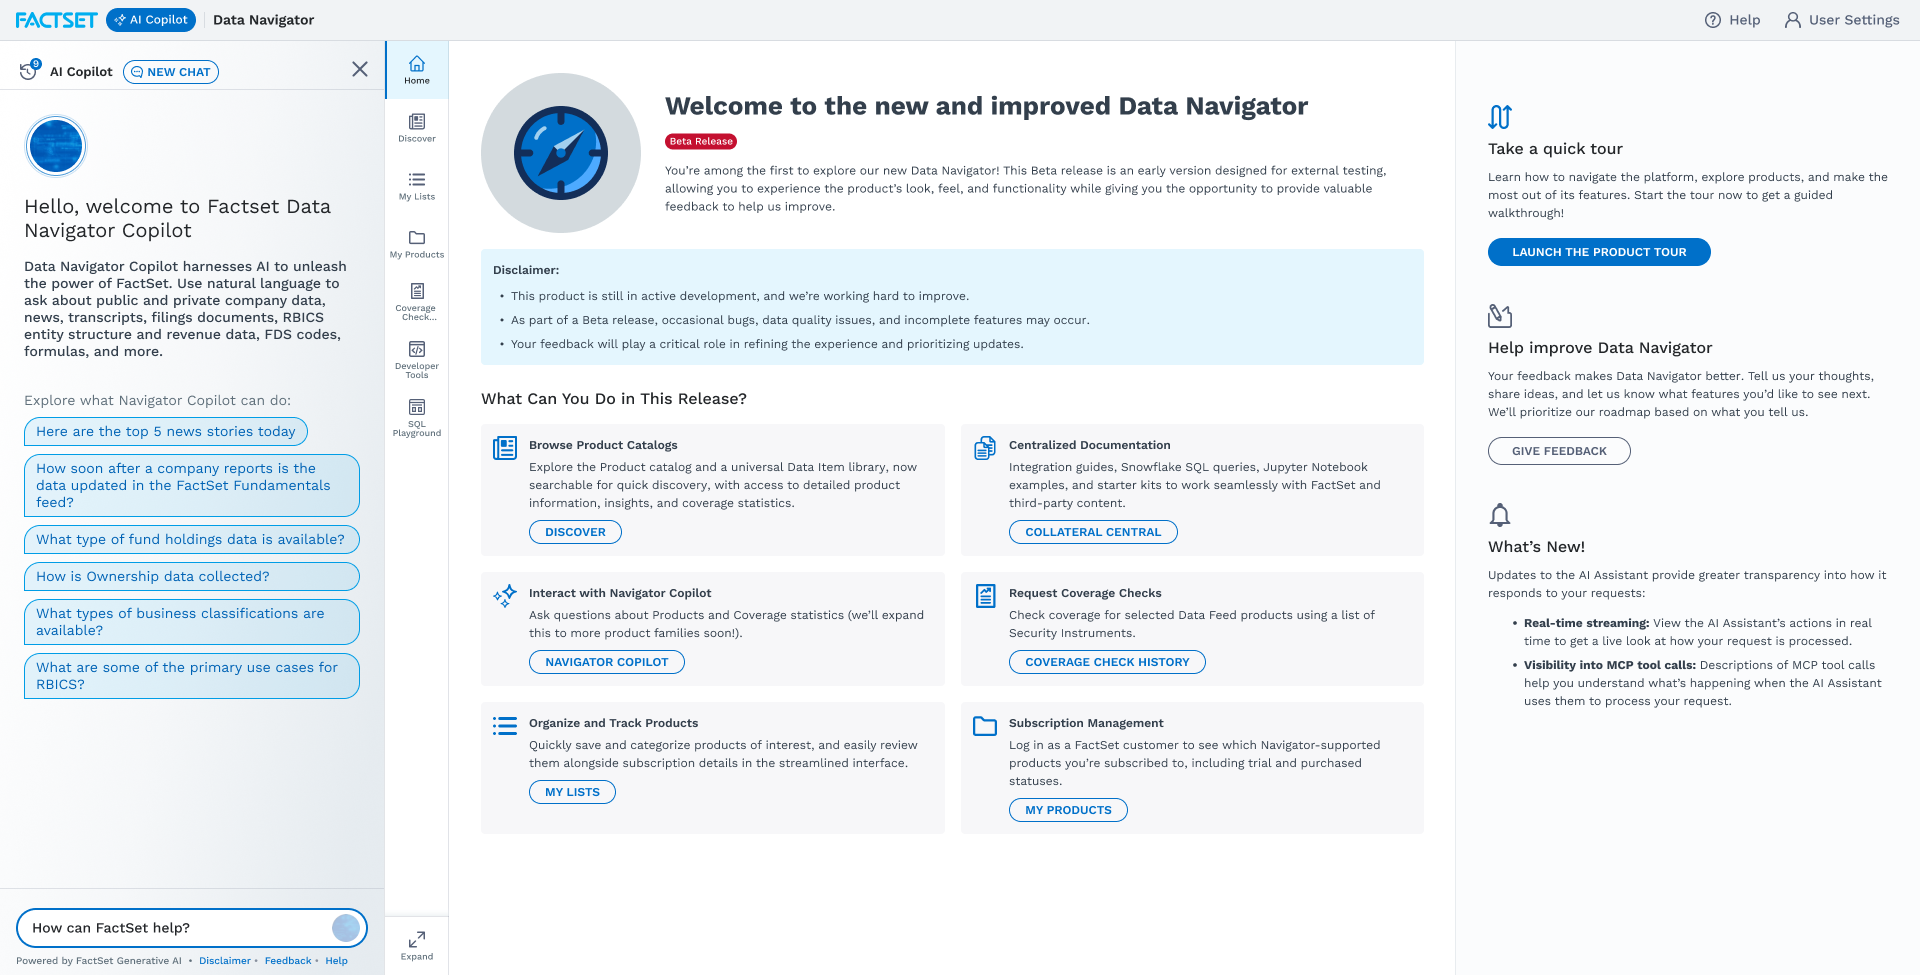
Before — original homepage
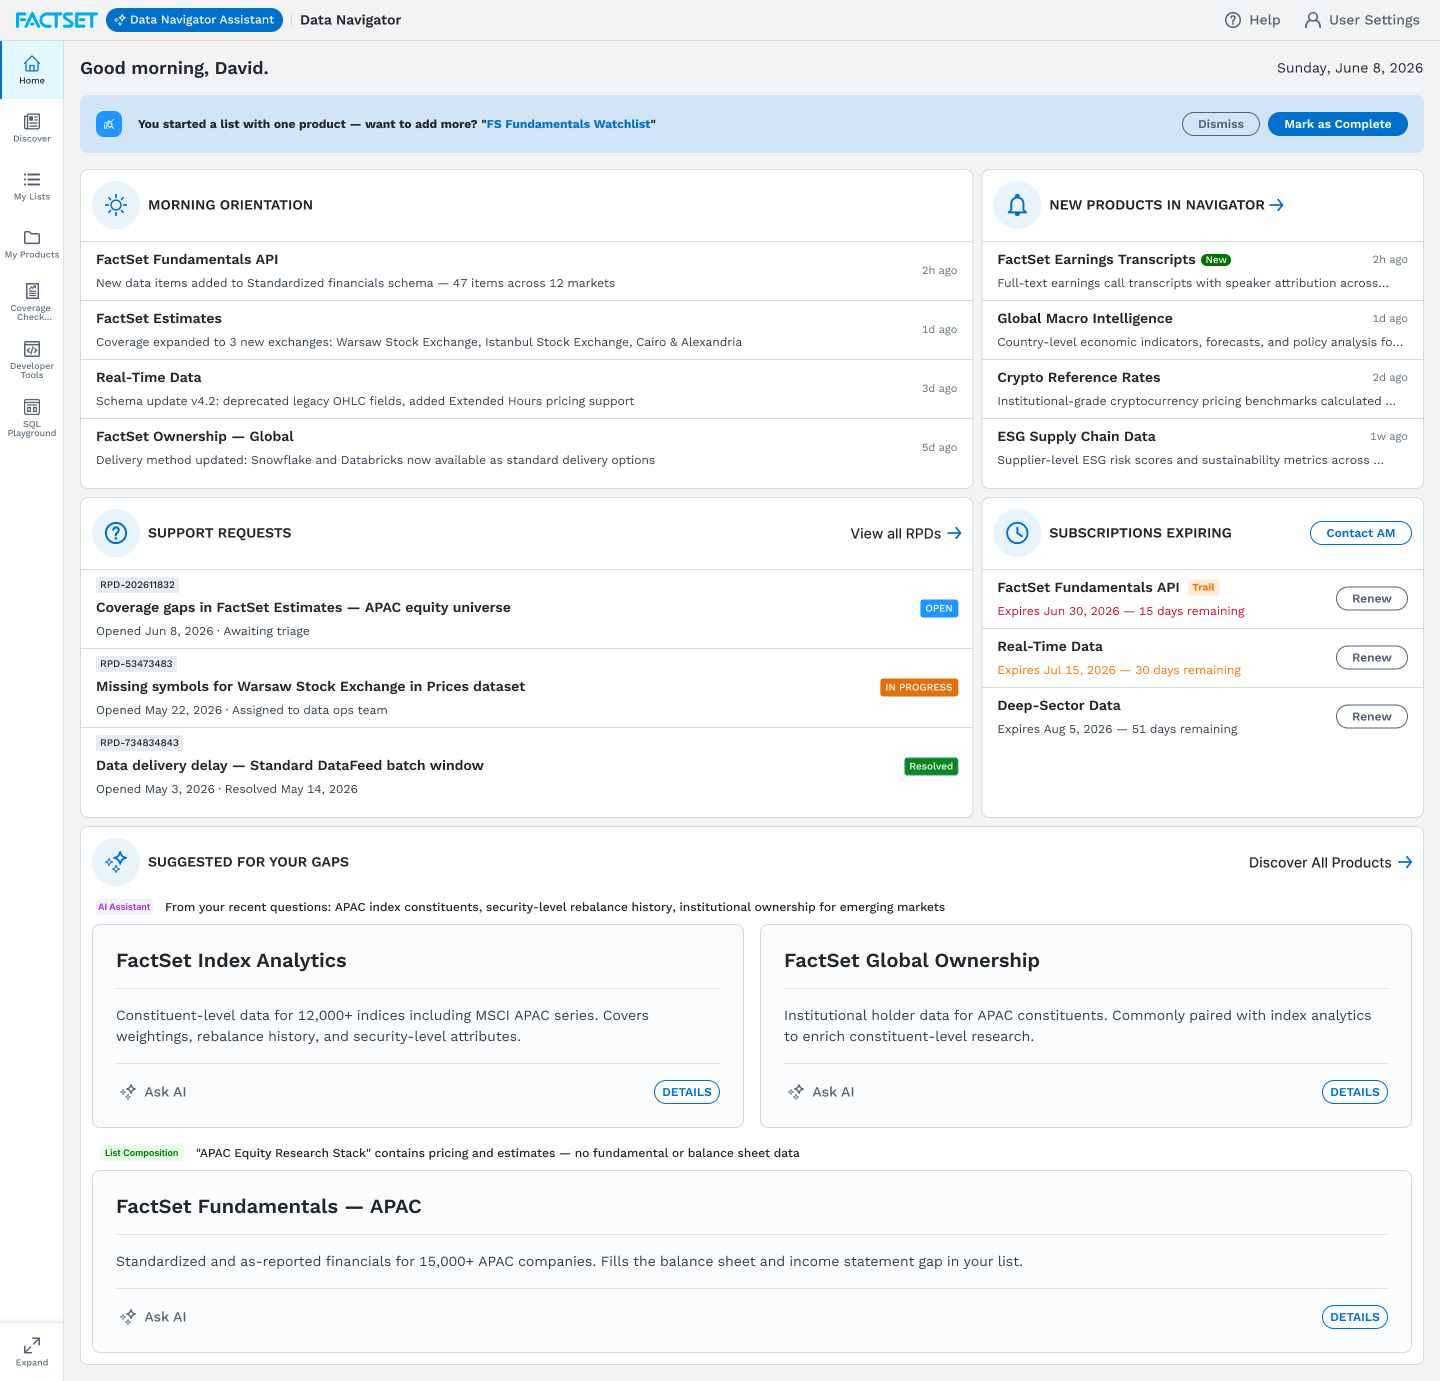
After — spec-driven dashboard
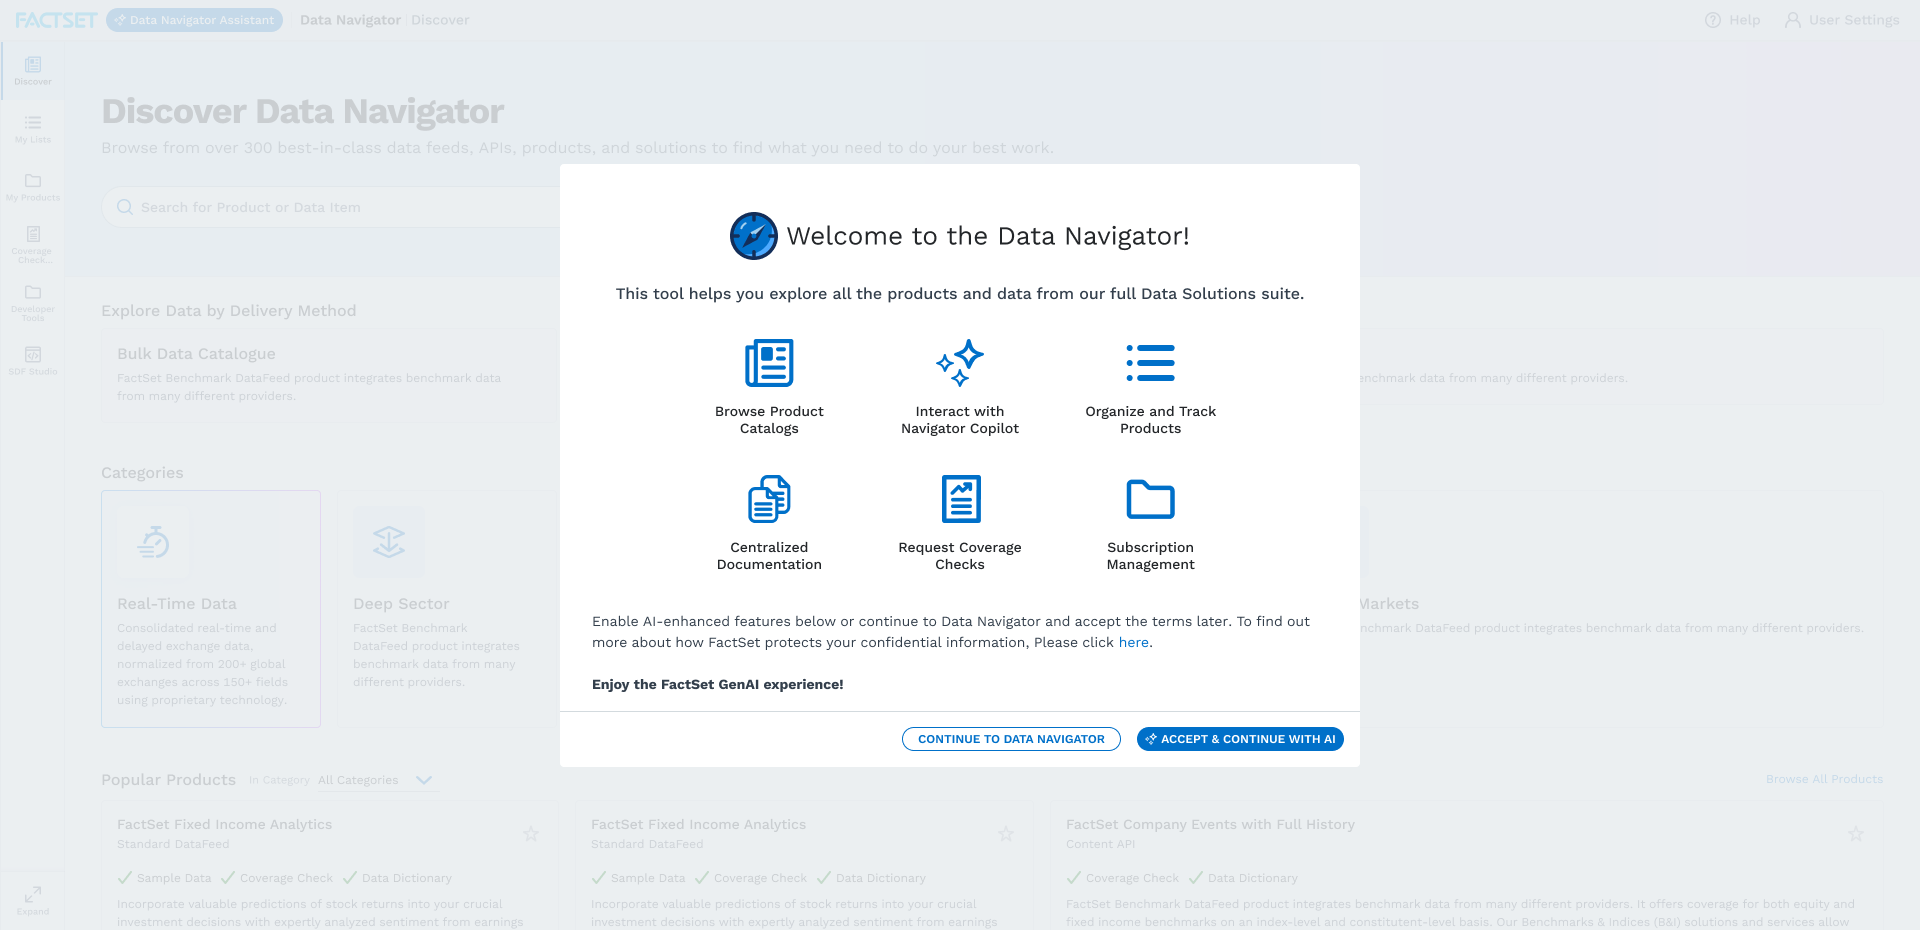
Updated first-time home experience
I conceived, designed, and built the Agent Catalog using the same Spec Driven workflow with Claude. The catalog gives users a browsable library of AI agents — each designed around a specific data workflow. I validated the concept with PMs and the sales team before a single sprint was committed. Implementation is starting in upcoming sprints.
The catalog has two key surfaces: a browsable agent list, and a configuration screen that walks users through the required inputs before running an agent.
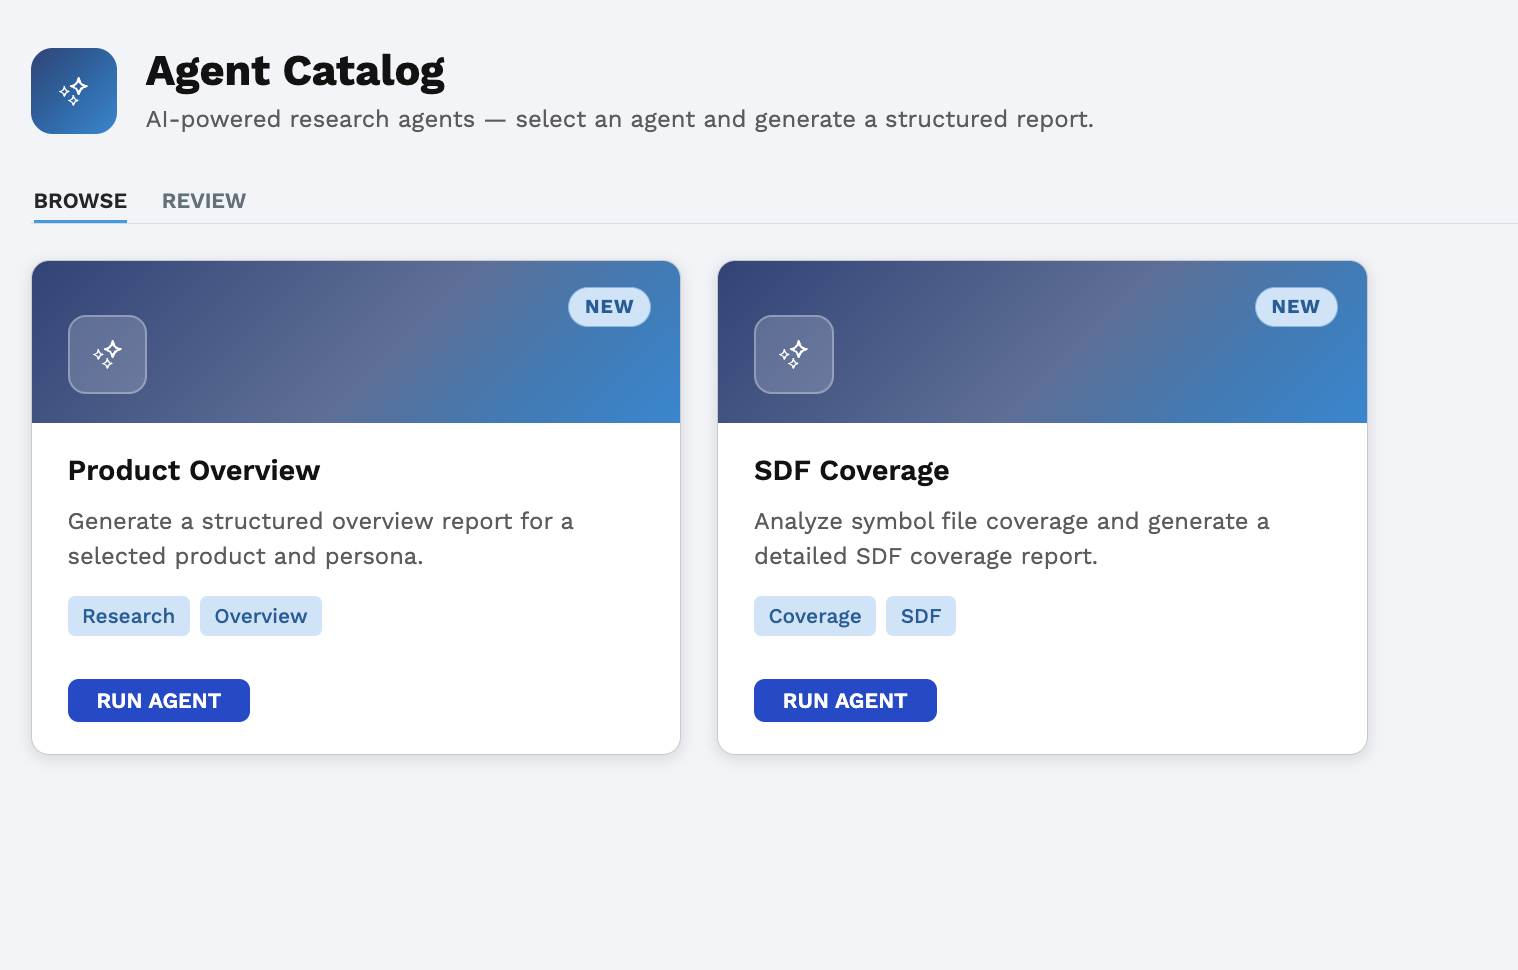
Agent Catalog — browse and discover agents
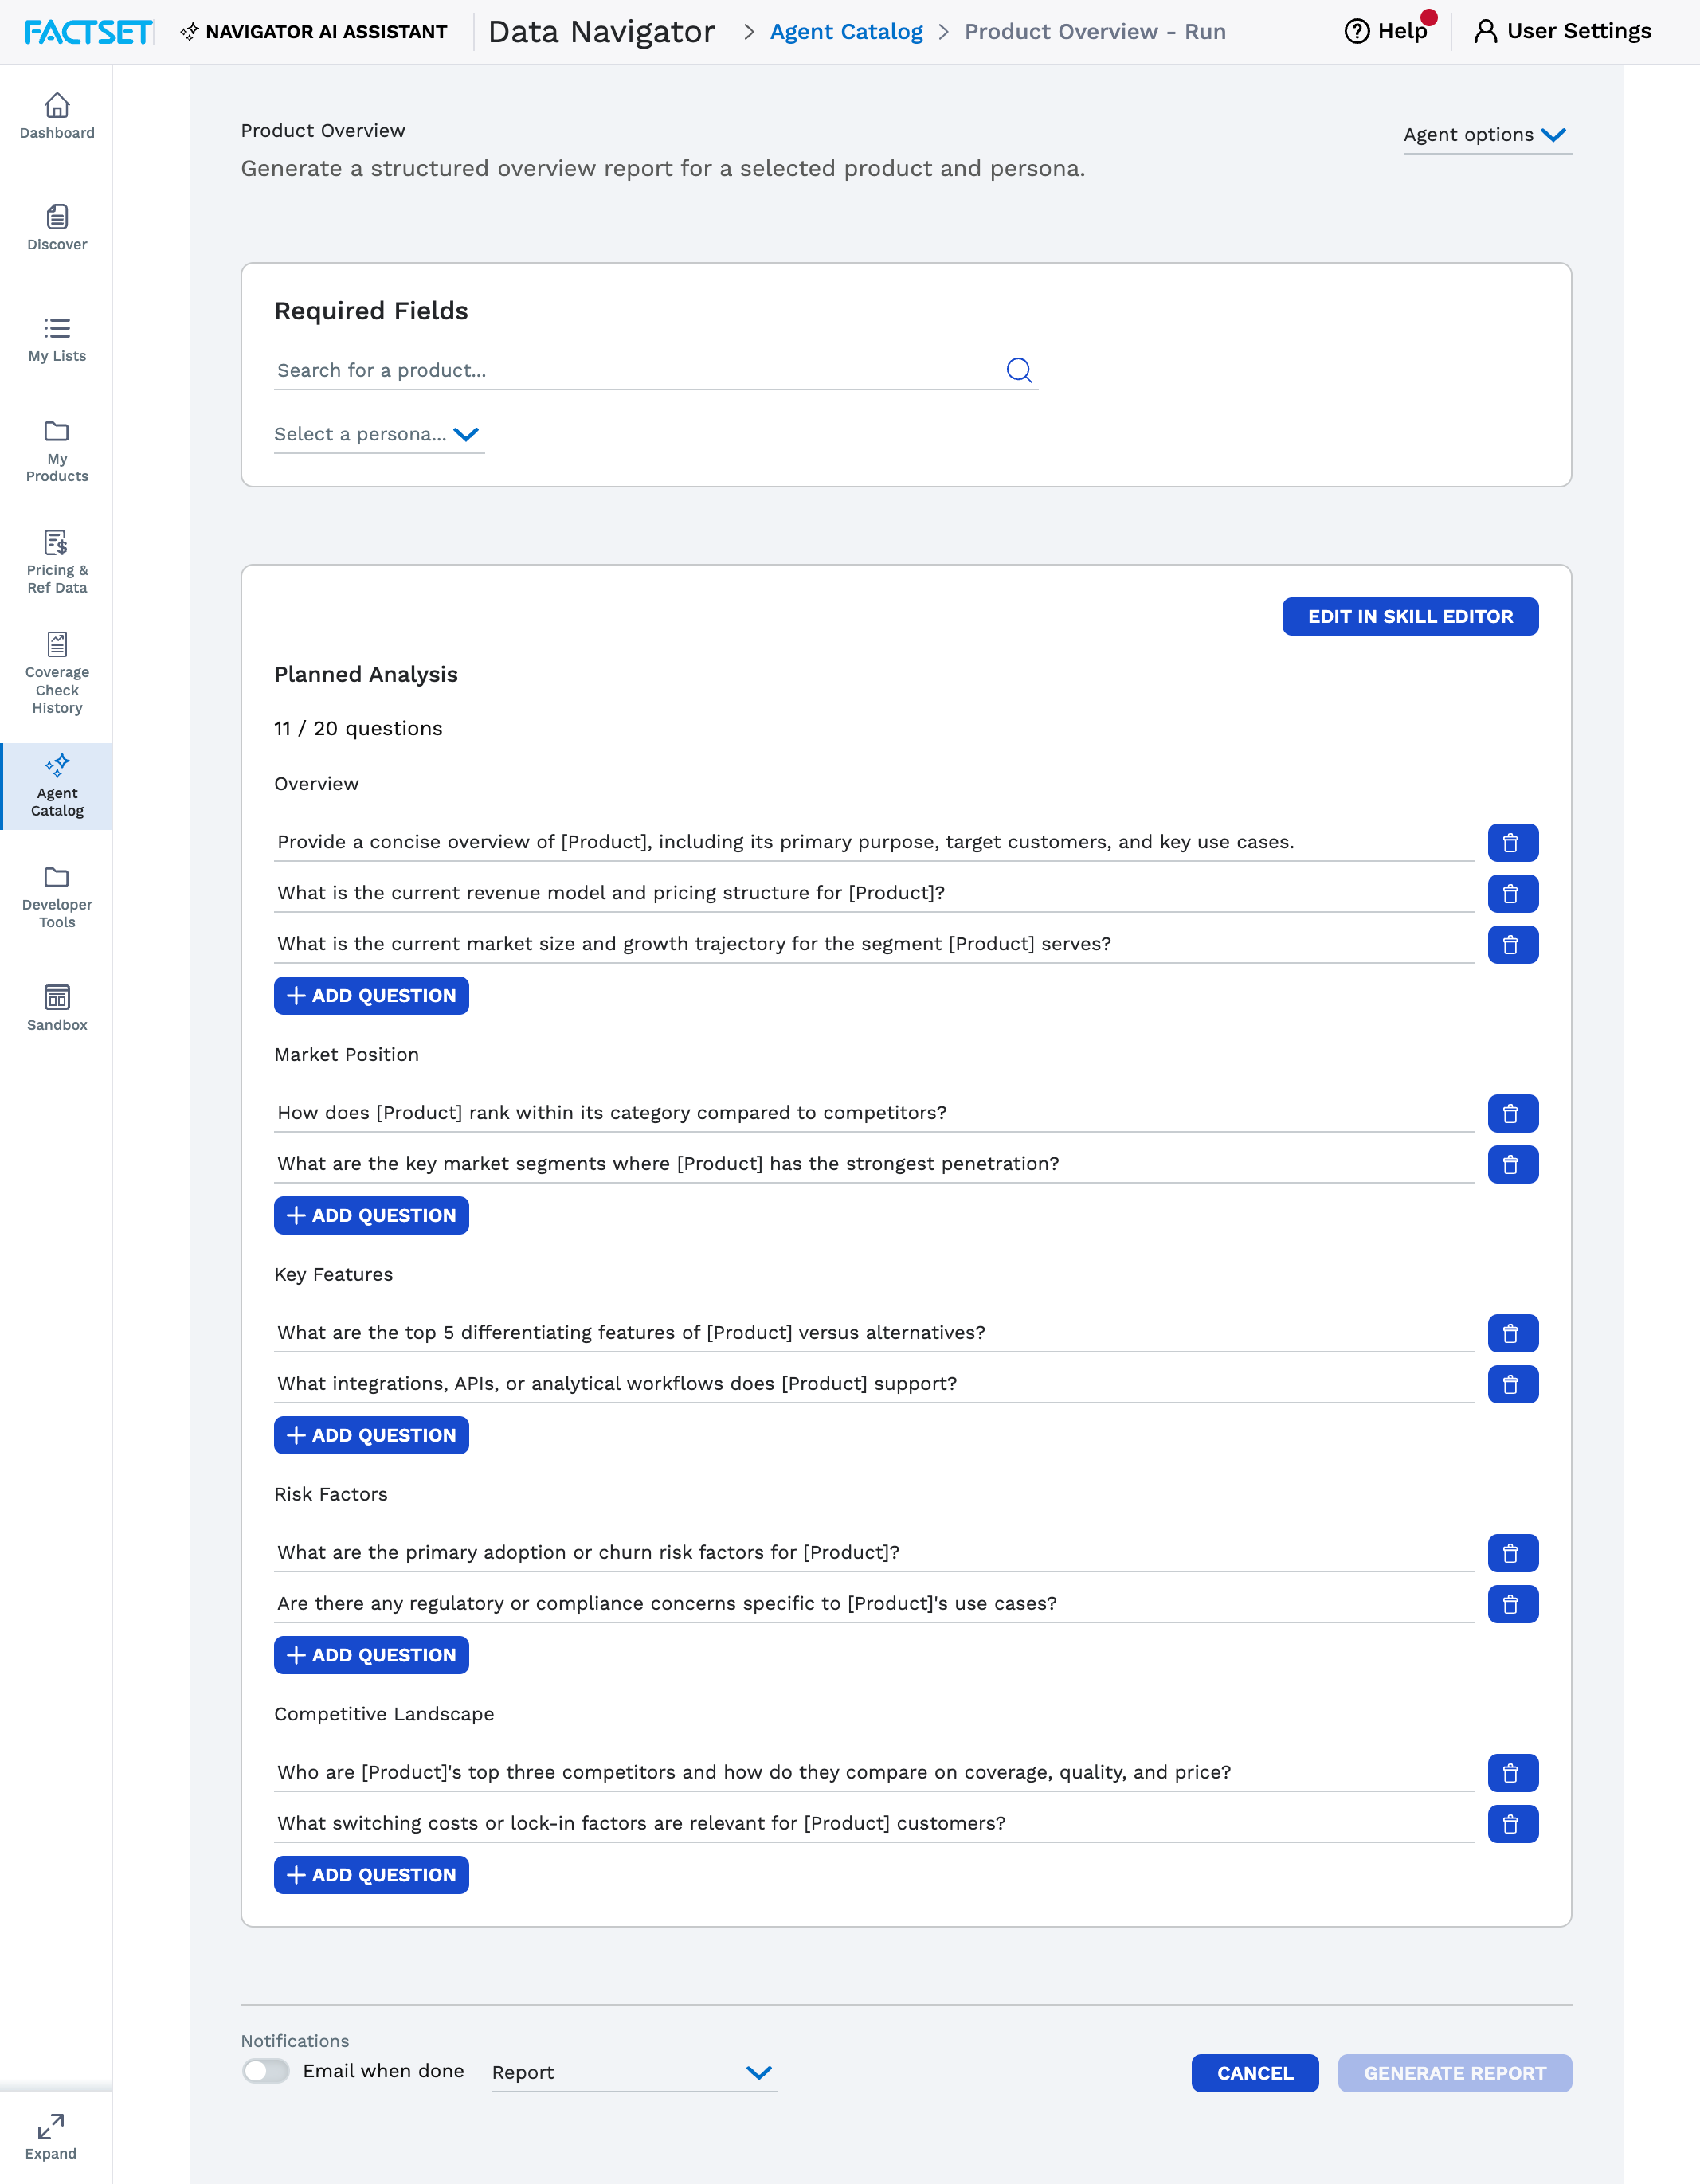
Run Agent — required inputs and configuration
Two agents were prototyped end-to-end to demonstrate the full workflow: a Product Overview agent and an SDF Coverage agent. Both show how agents surface structured, readable output tied directly to the user's data question.
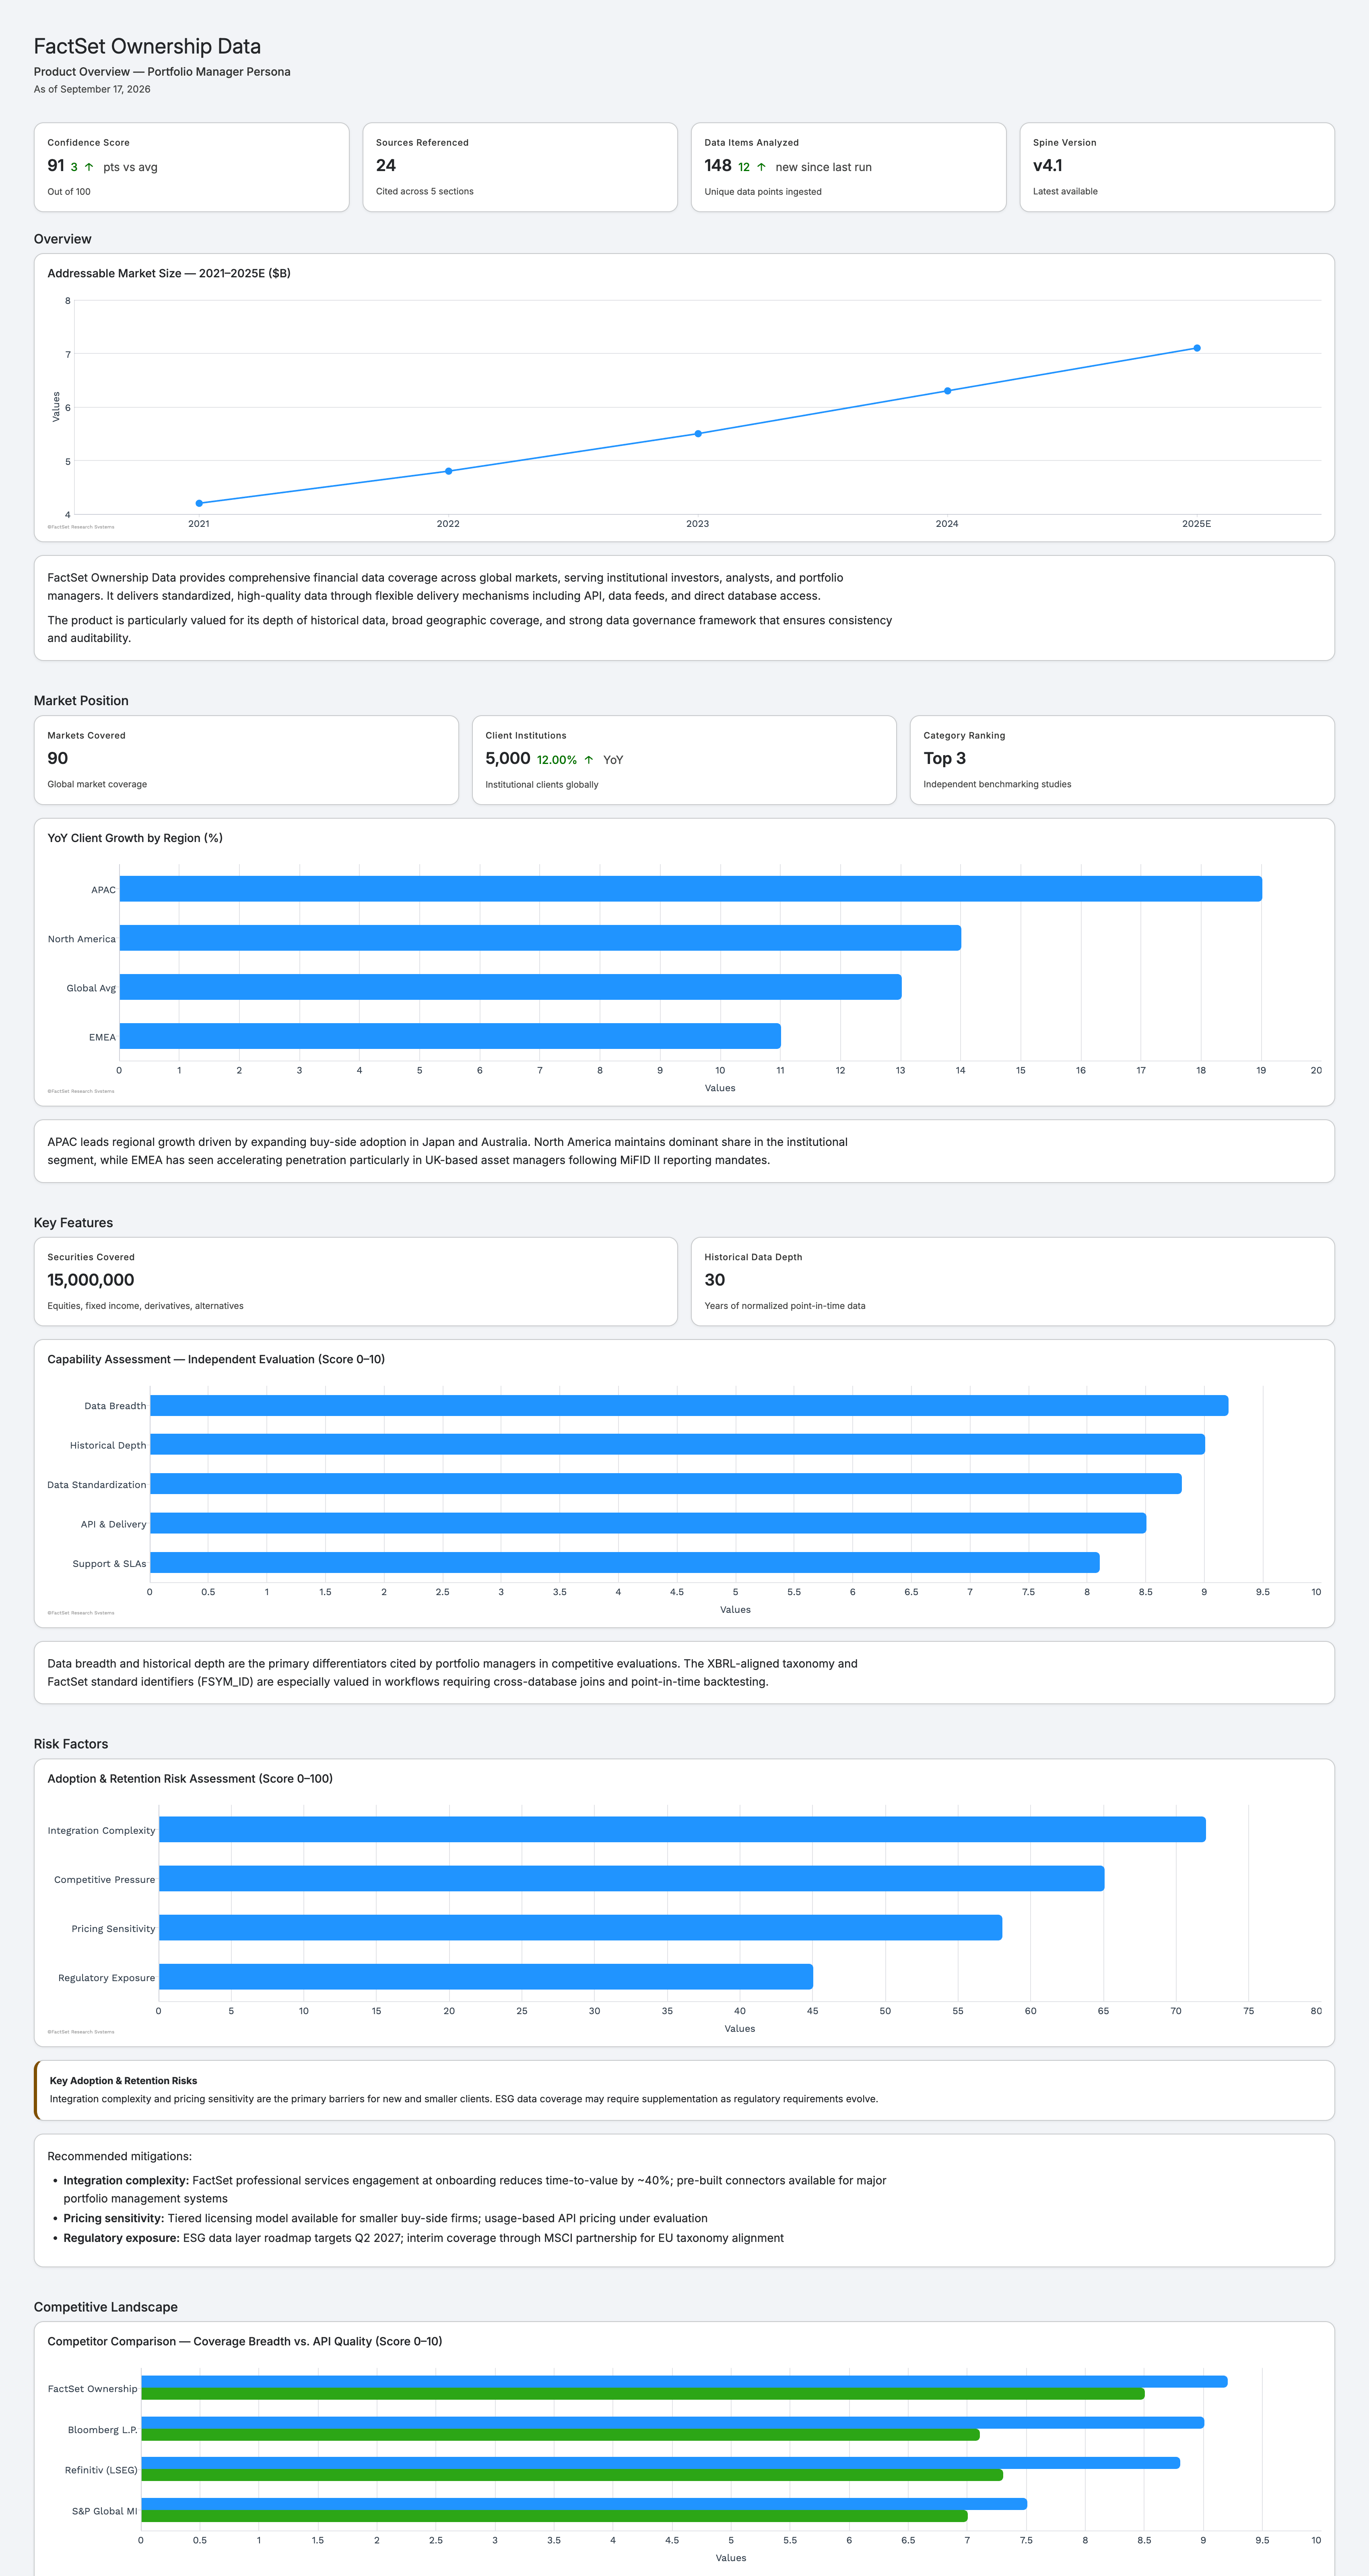
Product Overview agent — output demo
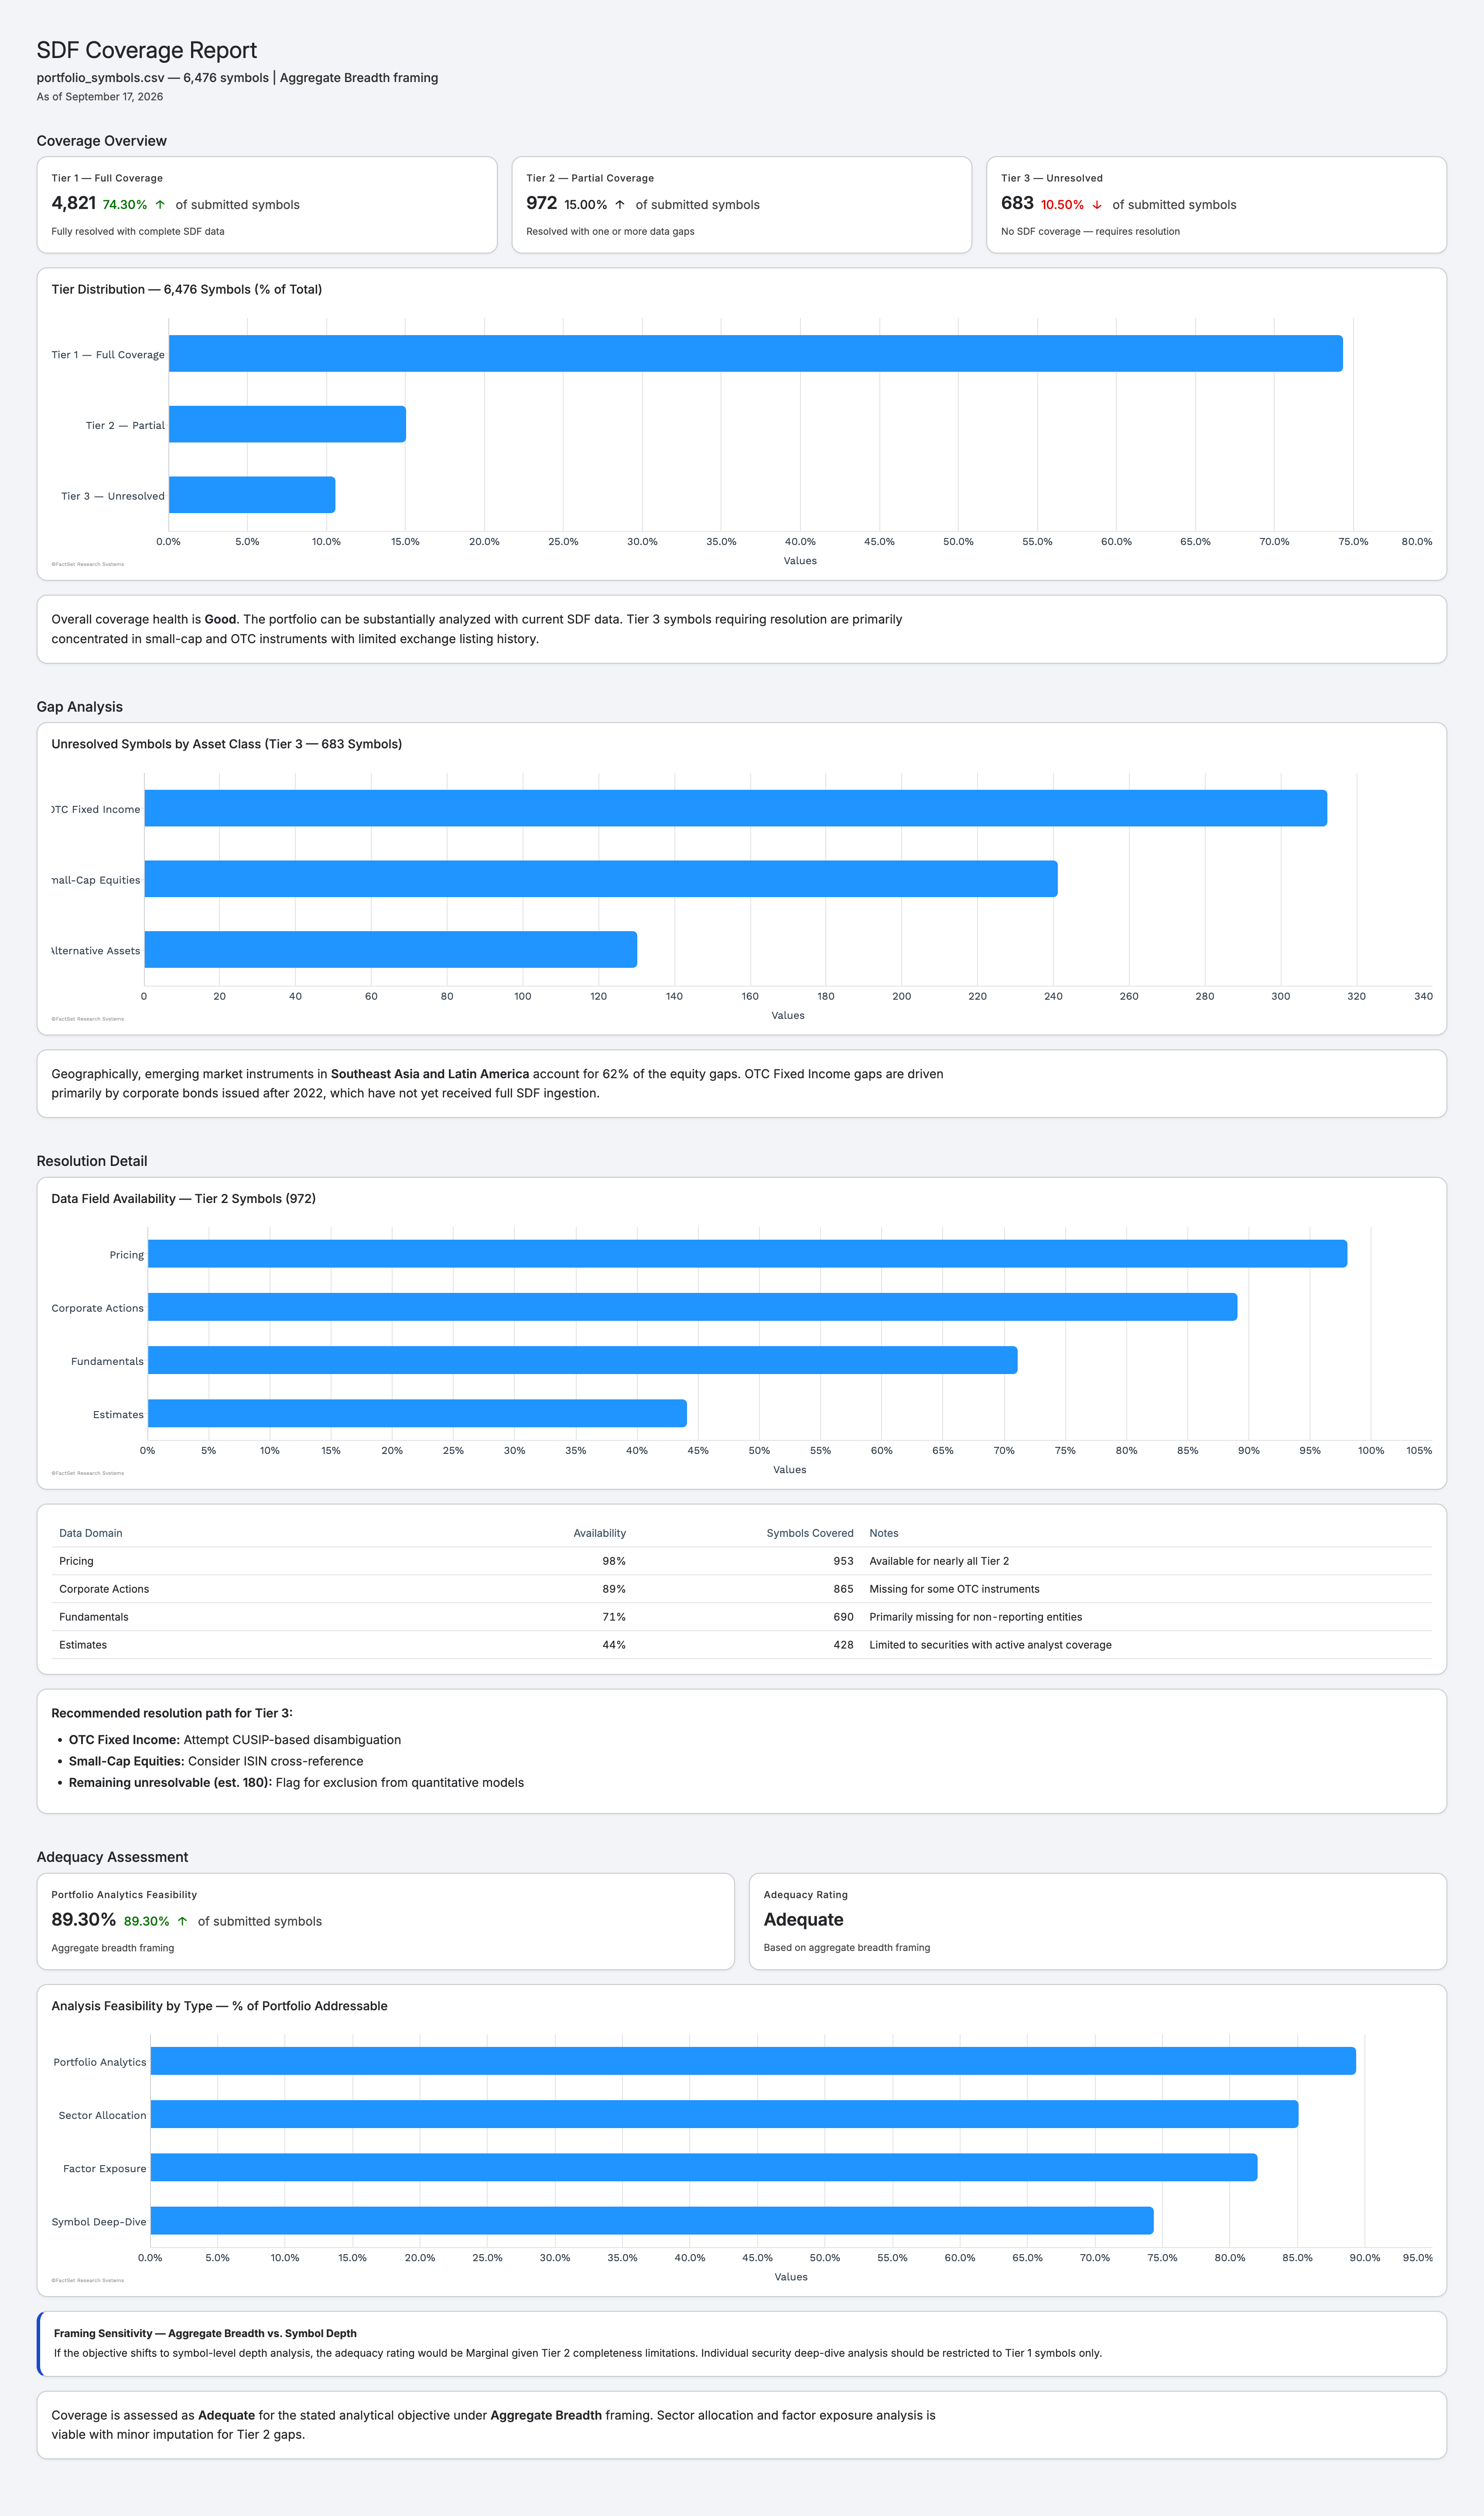
SDF Coverage agent — output demo
User research revealed a clear pattern: users relied heavily on AI Chat but weren't confident the answers were accurate. They liked the experience but had no way to verify the output. I redesigned the chat response pattern to include inline citations and the ability to view product details as evidence directly from the response — turning AI answers into verifiable, actionable information.
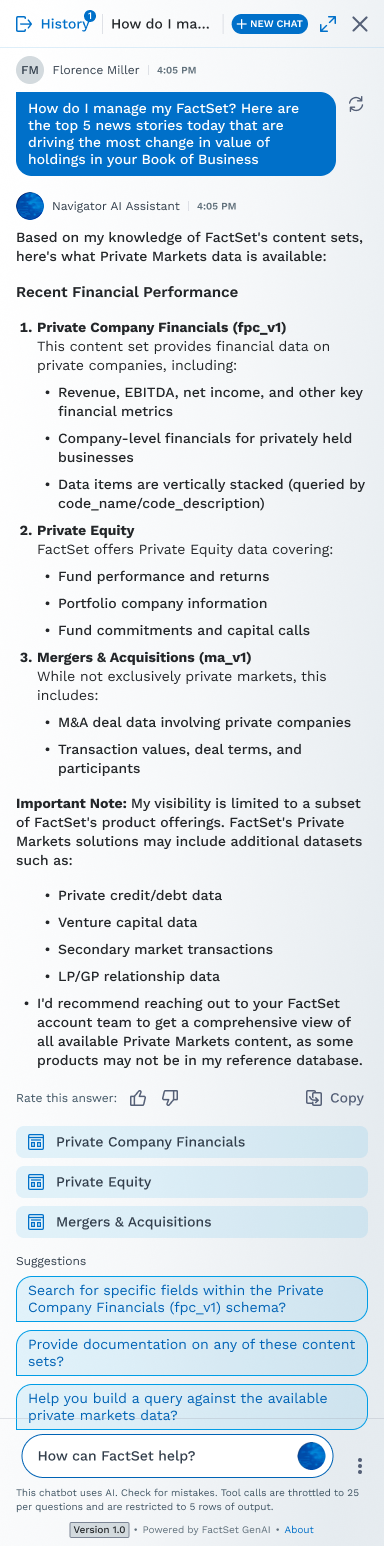
Updated chat — citations and product evidence
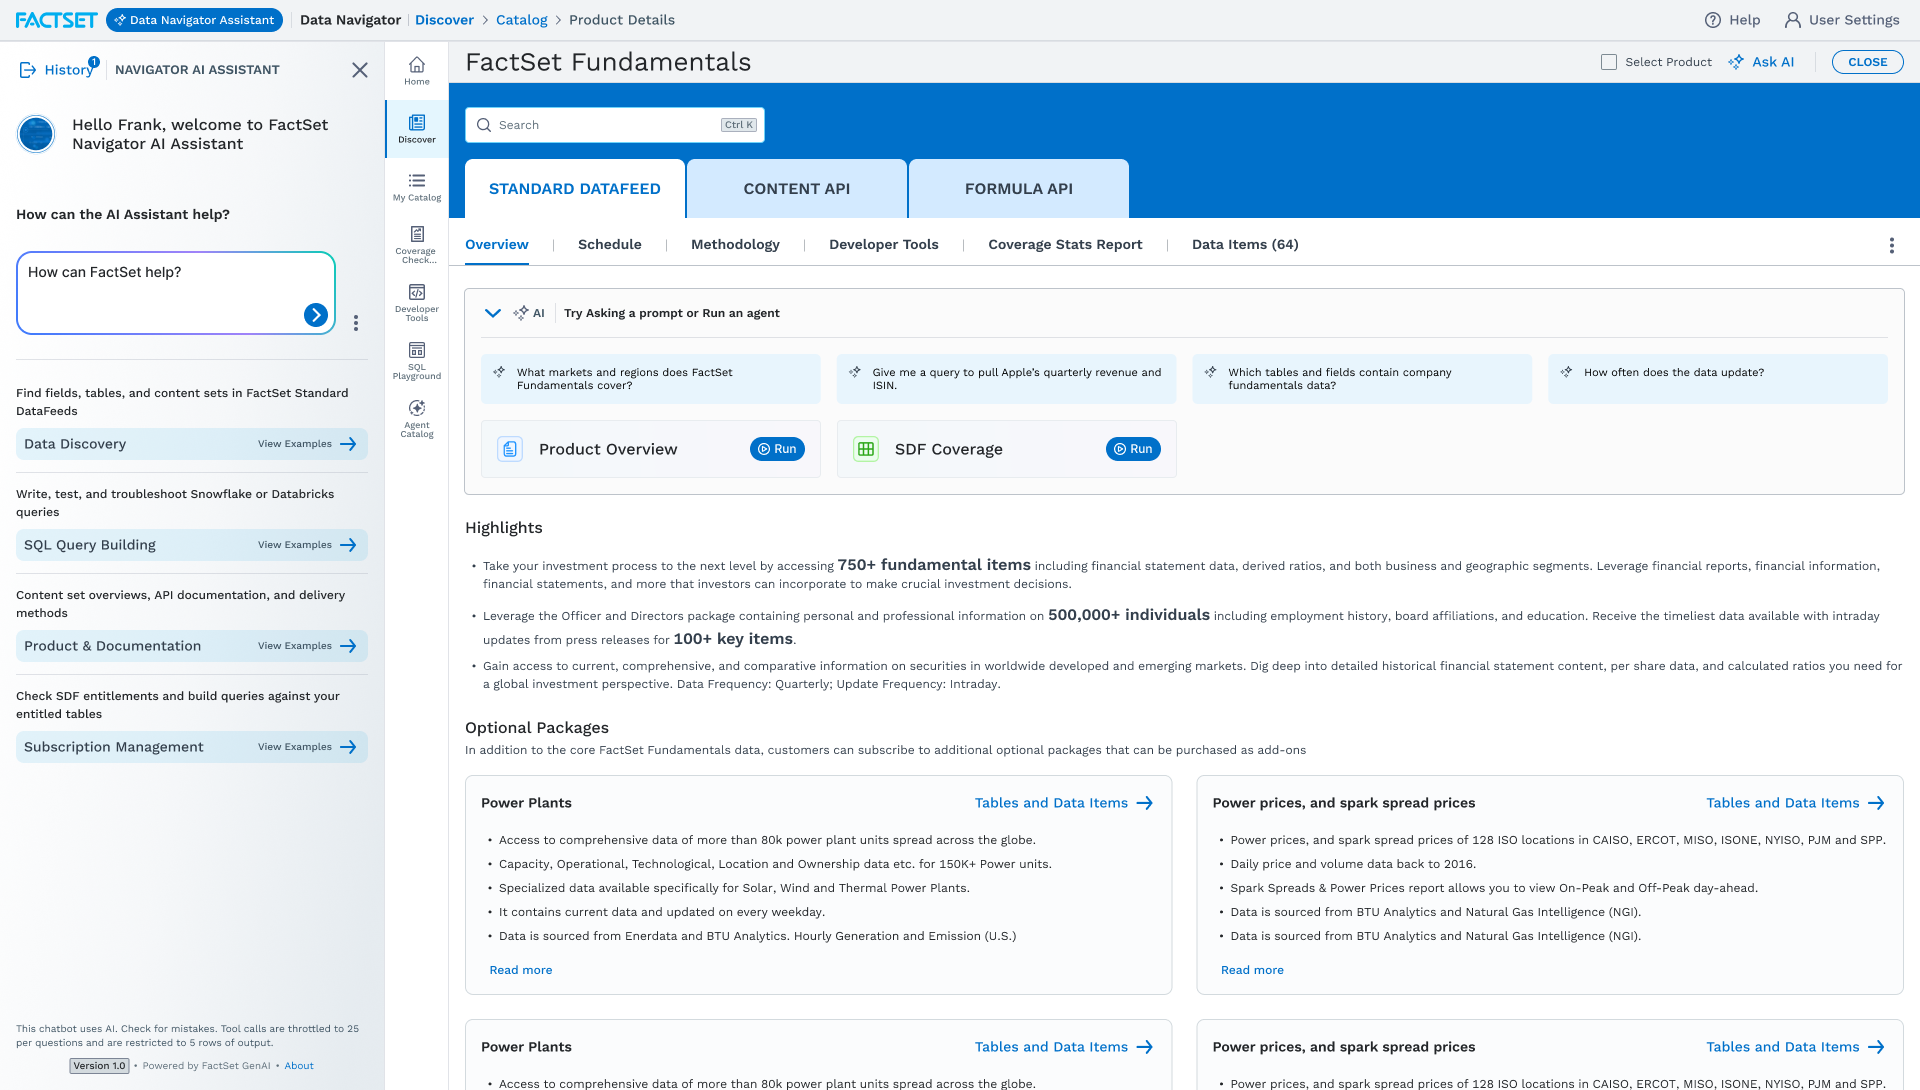
Product details — updated view from chat
The existing catalog was showing the same product multiple times — once per delivery method — with dense card detail that users didn't need at the browse stage. I simplified it: one card per product, delivery methods surfaced in the details view. Users can now scan the catalog faster and get to the right product without noise.
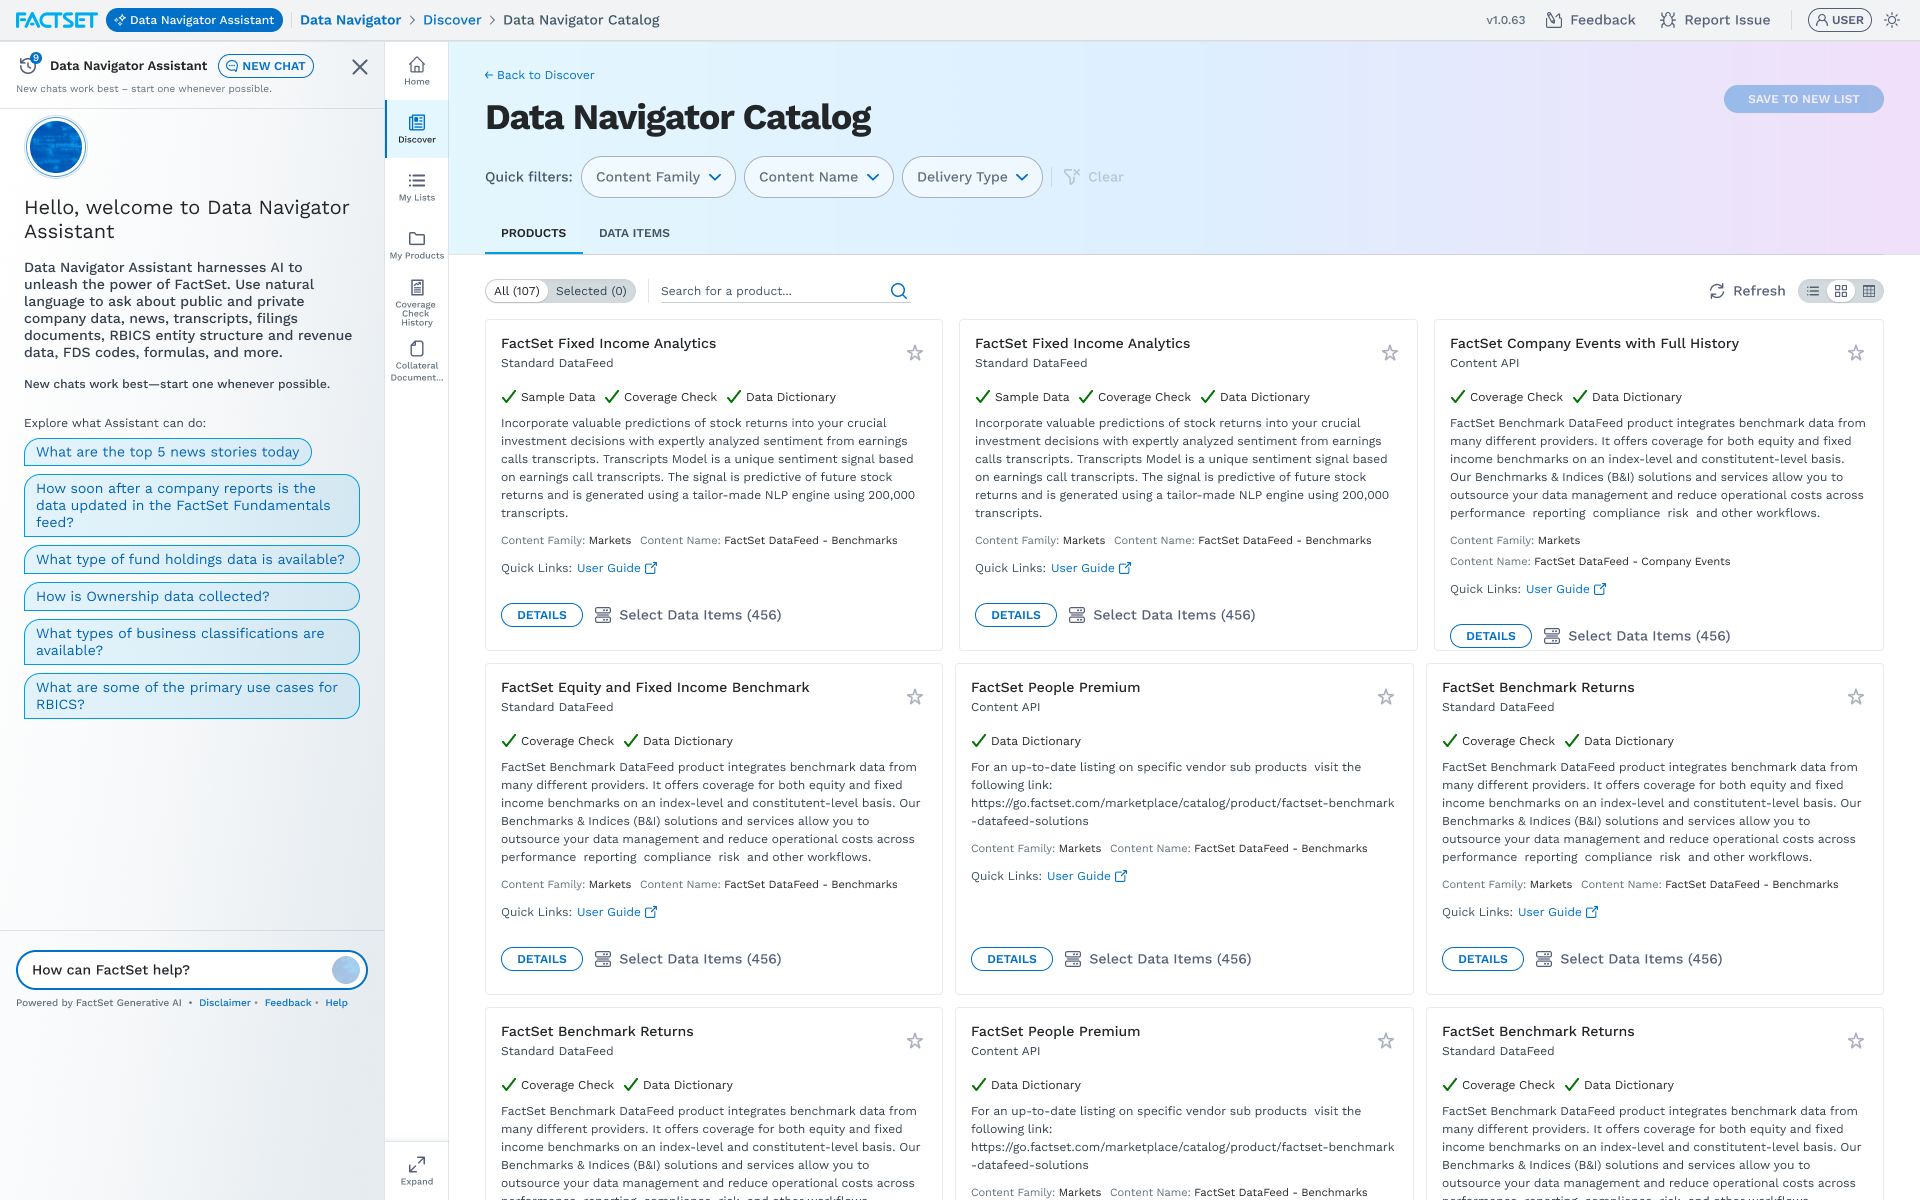
Before — same product repeated per delivery type
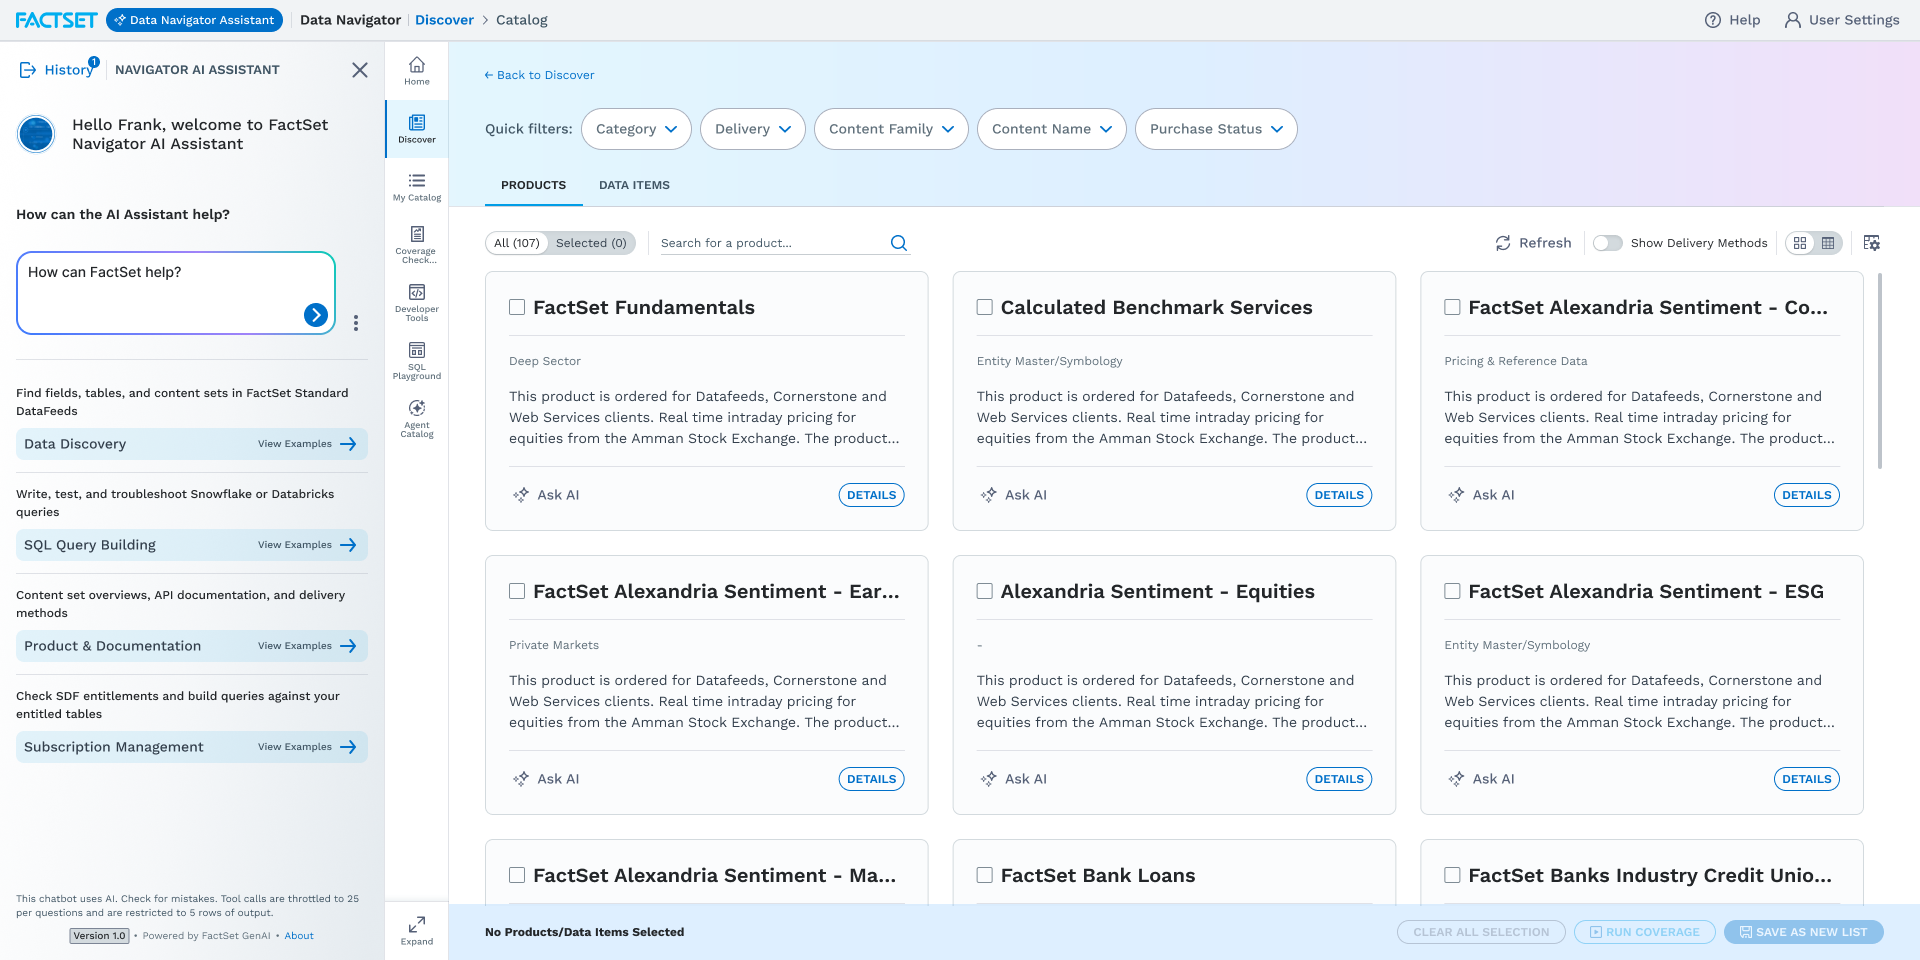
After — one card per product, simplified
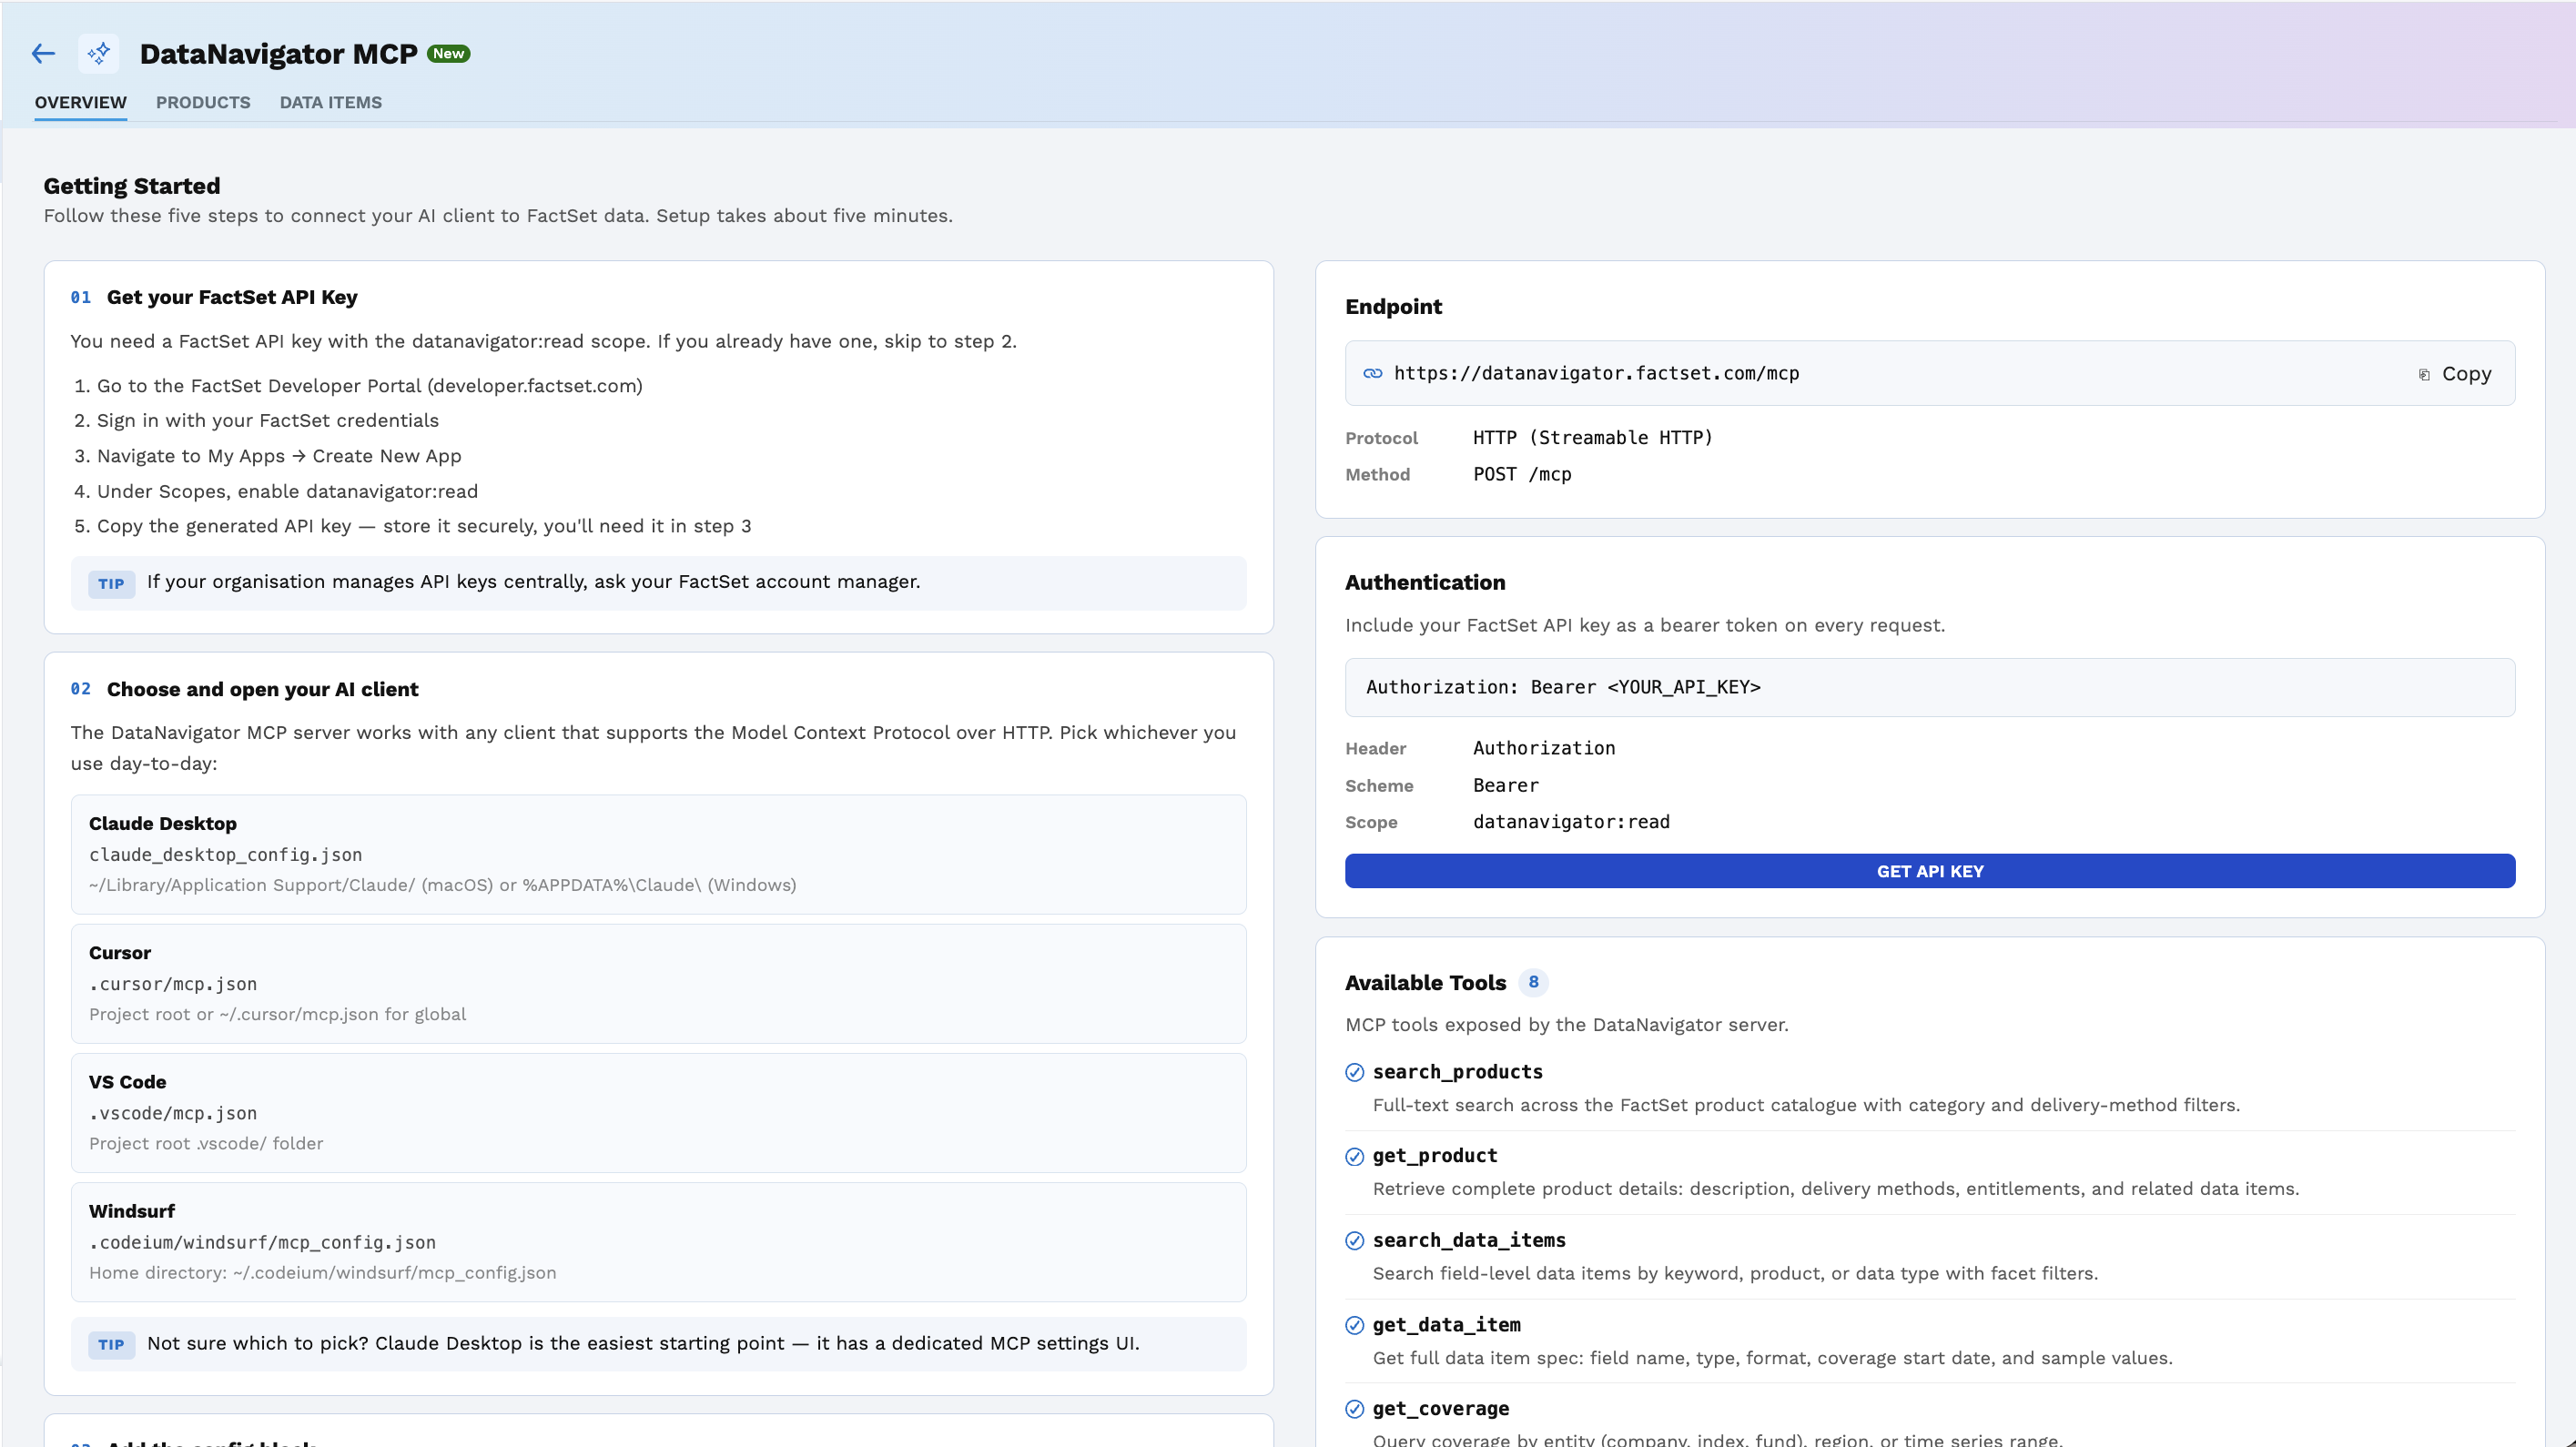
FactSet has an MCP (Model Context Protocol) integration — but it was only visible inside the core app. I designed a dedicated MCP page within Data Navigator, making it discoverable and accessible from the data discovery surface. Designed with Claude and finalized in collaboration with the engineering lead and PD.
- Production code shipped in a day: Coverage Stats redesign delivered as production-ready code in a single day — directly adopted by engineering without rework.
- Dashboard in under a week: Spec Driven workflow with Claude reduced hallucinations and kept output aligned to real requirements, cutting delivery time significantly.
- Agent Catalog validated before a sprint committed: Concept validated with PMs and sales upfront — implementation starts in upcoming sprints with full stakeholder buy-in.
- AI Chat trust improved: Citations and product evidence panels addressed the core user concern — answers are now verifiable, not just convenient.
- Catalog noise eliminated: Removing duplicate delivery-type cards made product discovery faster and reduced cognitive load for data consumers.
- MCP surface expanded: FactSet's MCP integration is now discoverable from the data discovery surface — not buried in the core app.
View Other Projects
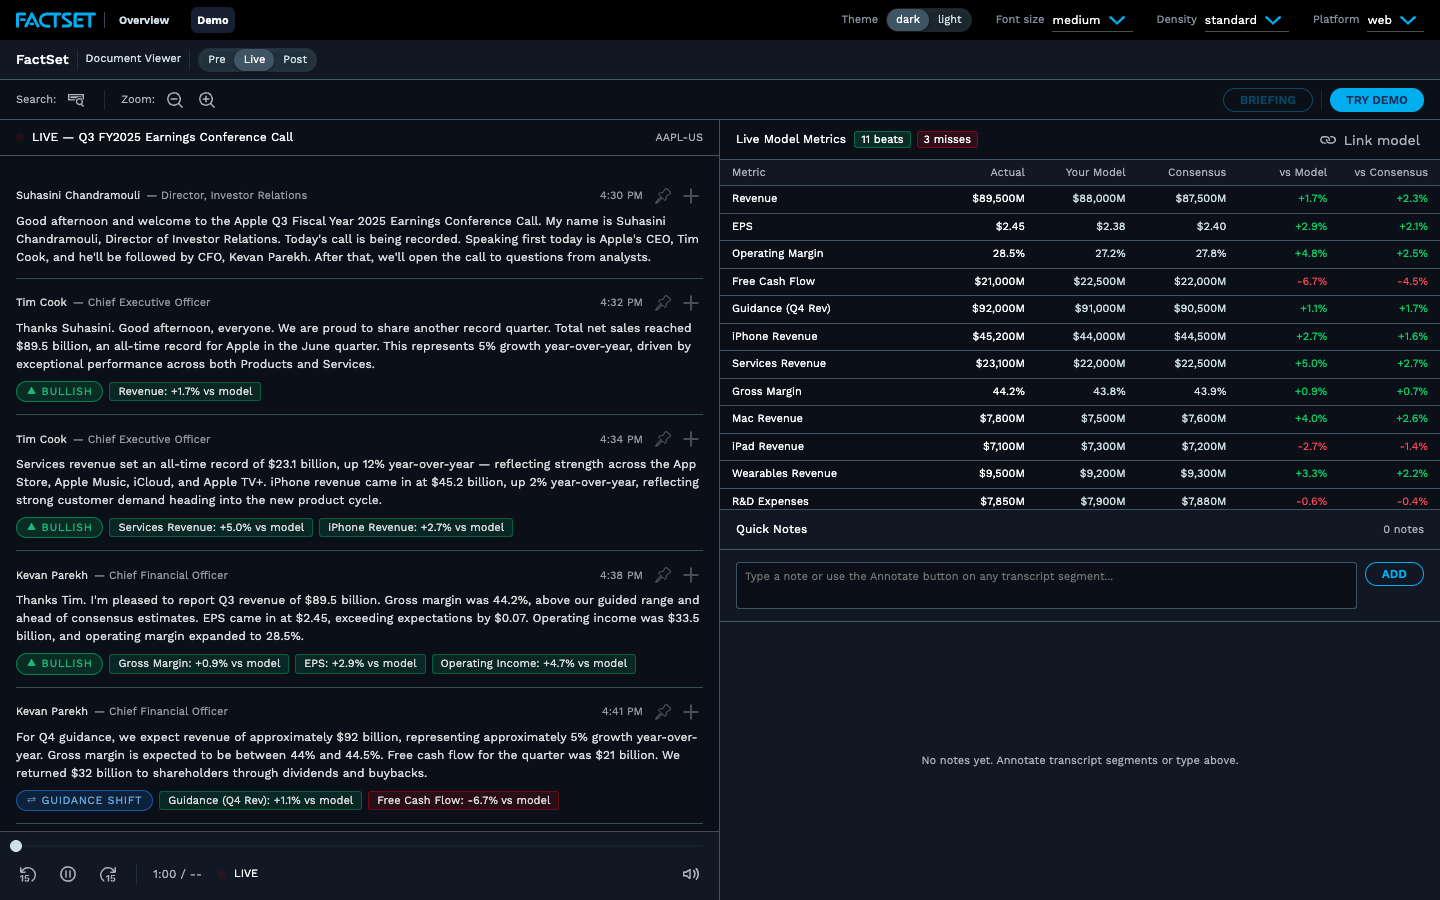
Earnings War Room
AI-powered live earnings research platform — transcript analysis, AI tiles, PM brief generation.
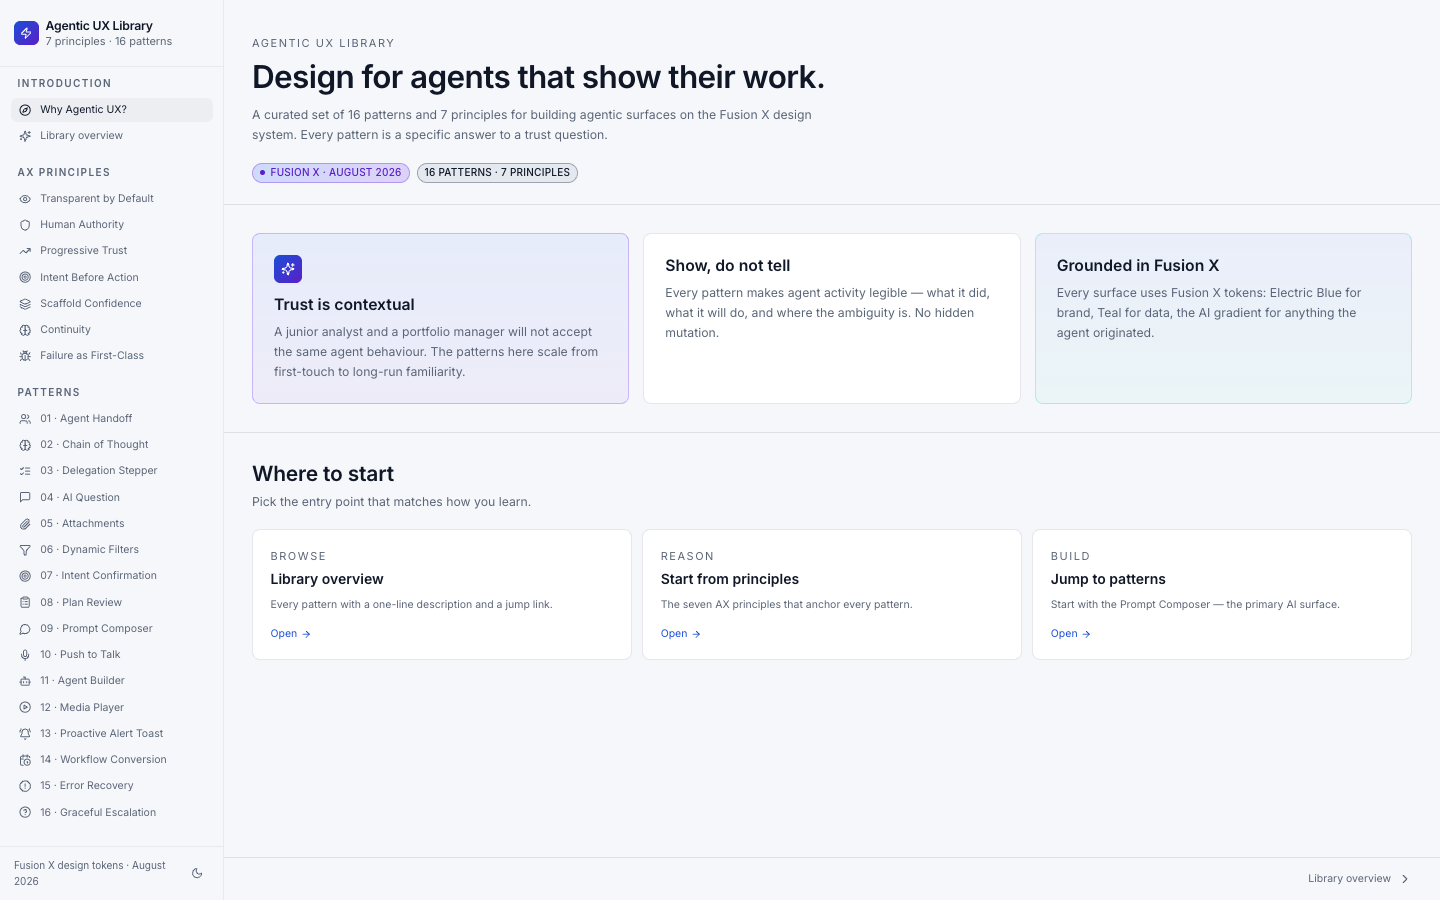
Agentic UX Principles & Patterns
Documented and published 51 patterns across 7 principles for AI-agentic interface design.