Earnings War Room
AI-Powered Live Earnings Research Platform
Buy-side analysts spend hours each earnings season juggling disparate tools — switching between live webcasts, PDF press releases, model spreadsheets, and chat — to track company performance and form investment views. Critical signals are missed, briefings are late, and the cognitive load is enormous.
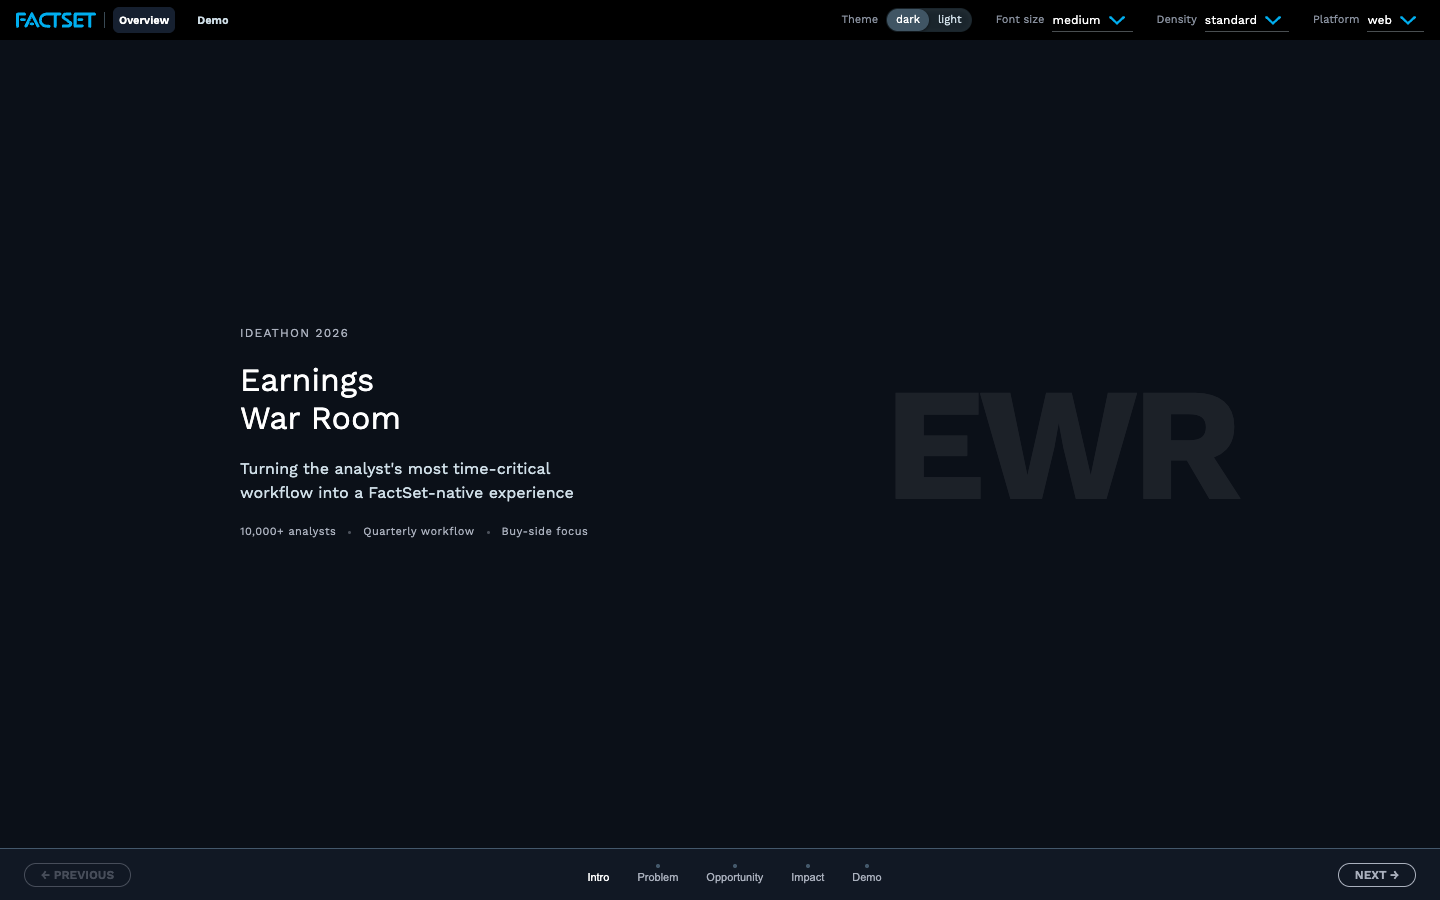
Earnings War Room is a live coded prototype designed and built during a FactSet hackathon to reimagine this workflow: a single AI-powered surface that consolidates live earnings events, intelligent analysis, and briefing generation — all in real time.
Lead UX Designer & Prototype Engineer. I collaborated with fellow designers to conceive the idea, designed the end-to-end experience, and built it as a fully functional Vue prototype to demonstrate the concept to stakeholders, validate with analysts, and drive product conversations.
"I wanted to reach out and say great work on the Live Earnings Agent! It is a really cool concept and I love the personalization factor that it brings to the use case – I hope we can drive this to an impactful release. Thanks for your innovation and ideation in the hackathon and beyond!"
— FactSet CTO
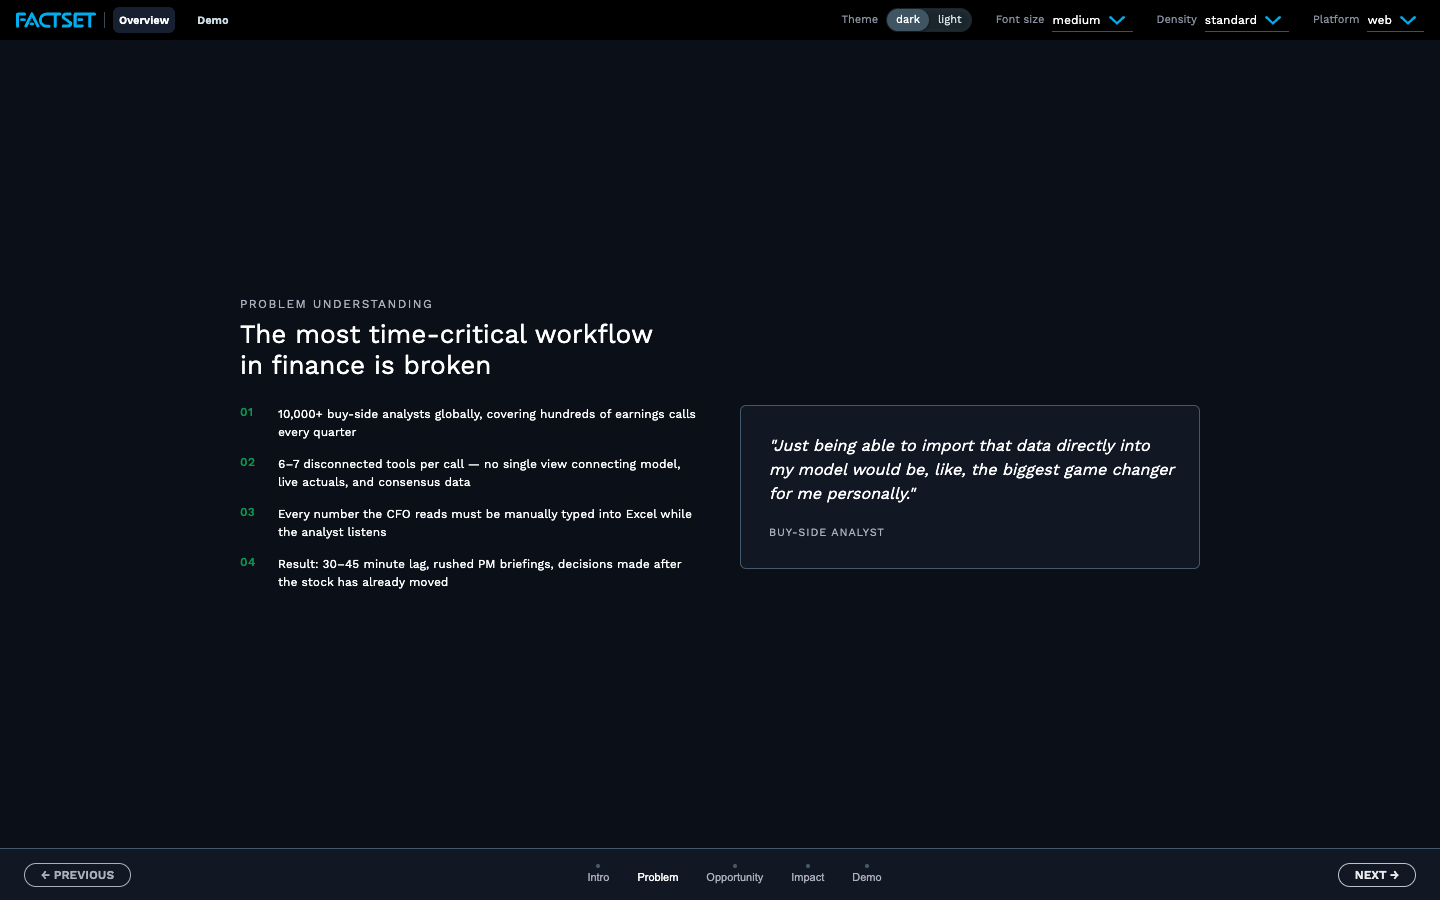
Problem framing — fragmented analyst workflow
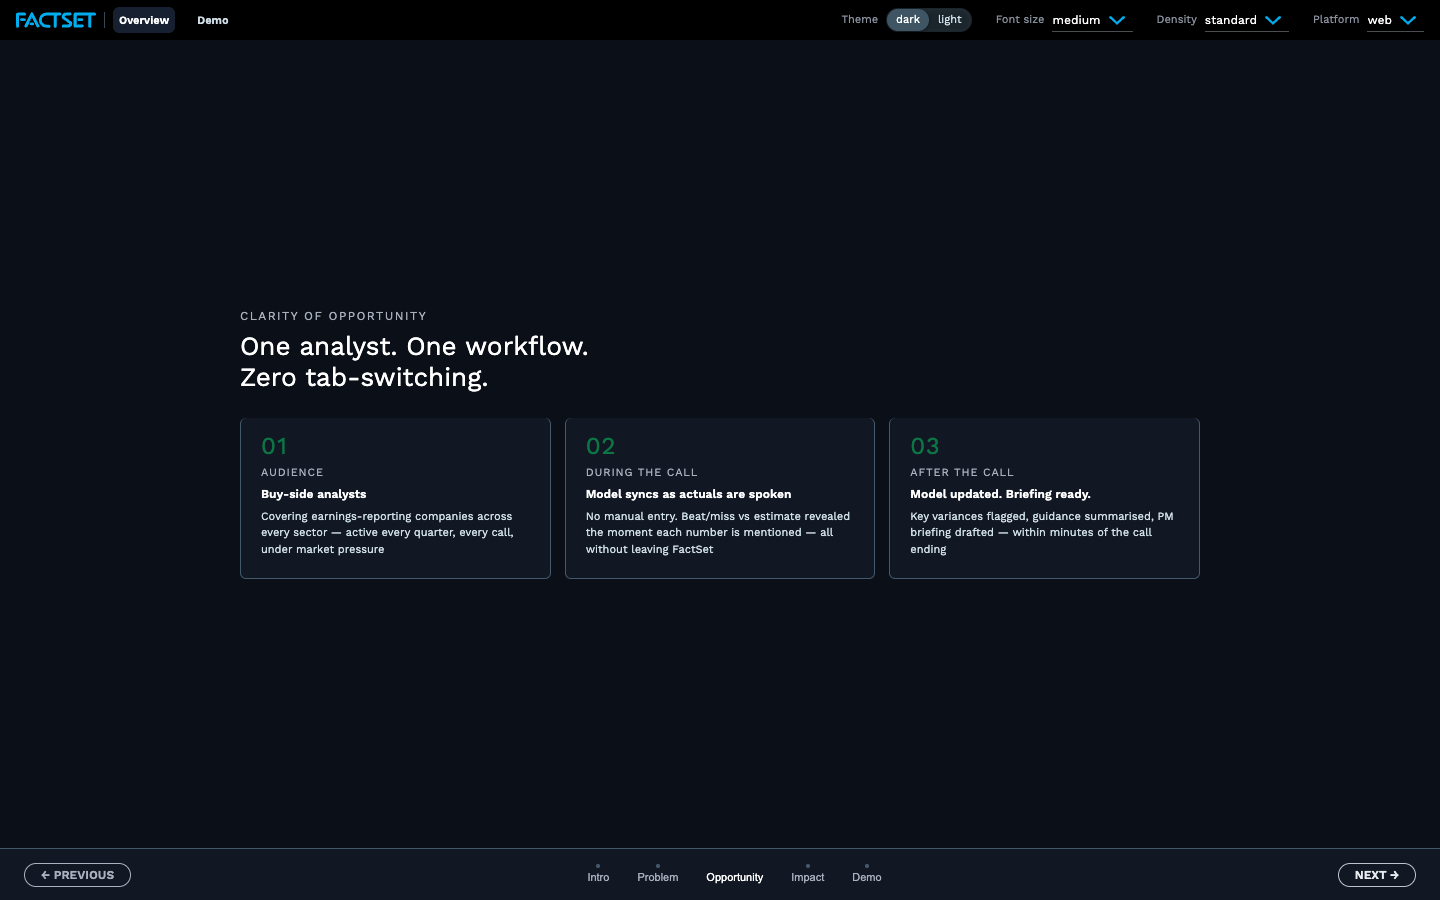
Opportunity space — where AI can reduce friction
During a live earnings call, a buy-side analyst needs to simultaneously:
- Listen to or read the live transcript
- Compare actuals vs. their model estimates
- Understand management tone and sentiment signals
- Synthesize sell-side expectations
- Update their position rationale in real time
- Brief their PM before market opens
Design Problem: How do we reduce cognitive load and decision latency for analysts during the most time-critical moments in their workflow?
I designed and prototyped a three-panel layout that adapts across the earnings lifecycle — from pre-earnings preparation to the live call to post-event briefing.
Setup assessment, ingoing scenarios, position rationale, sell-side consensus summary, macro signals — all surfaced before the call starts.
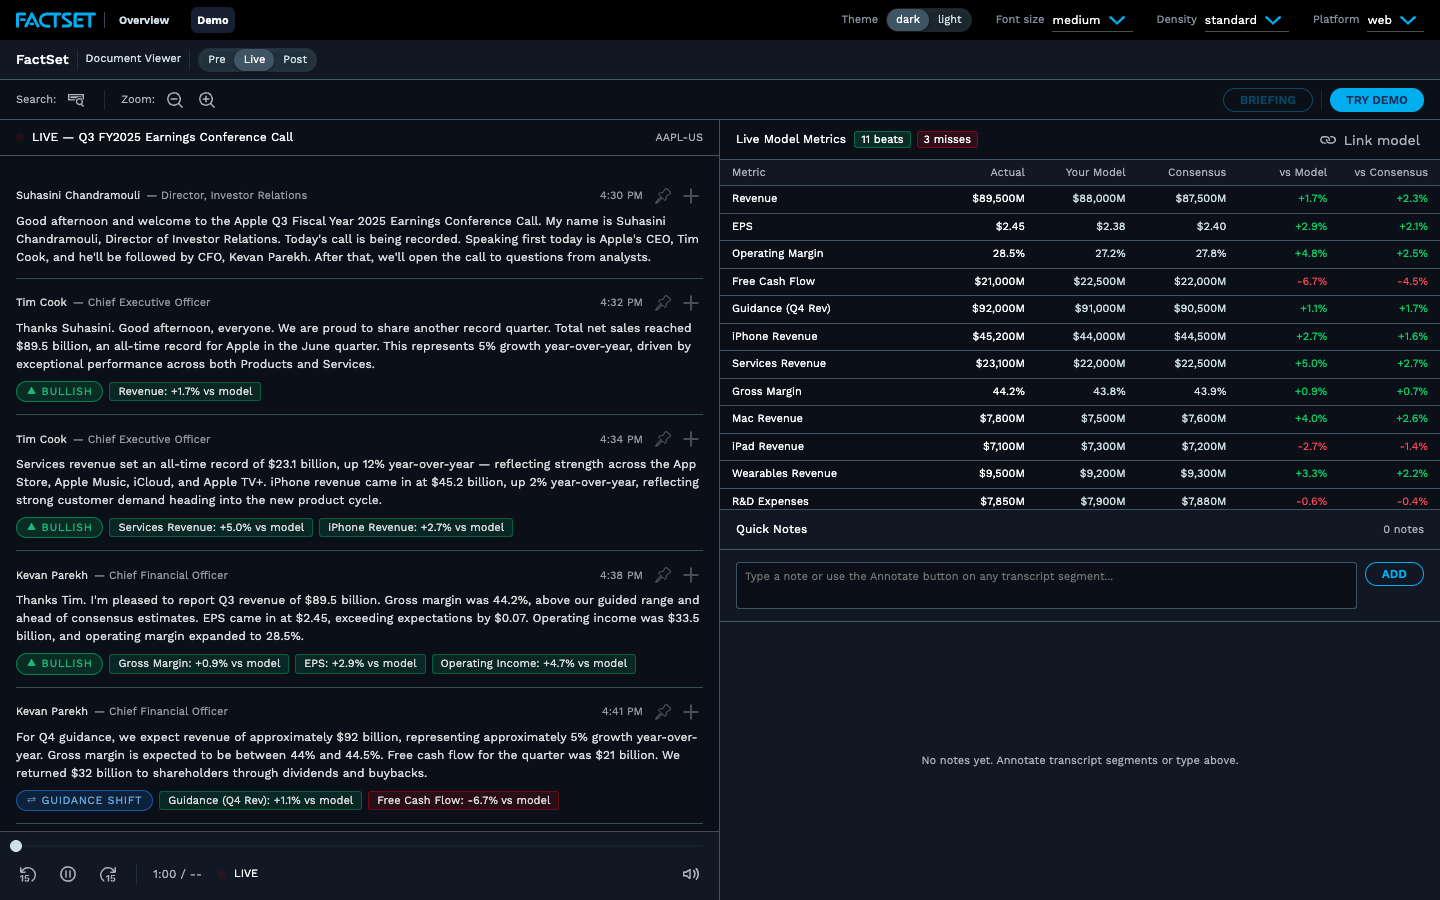
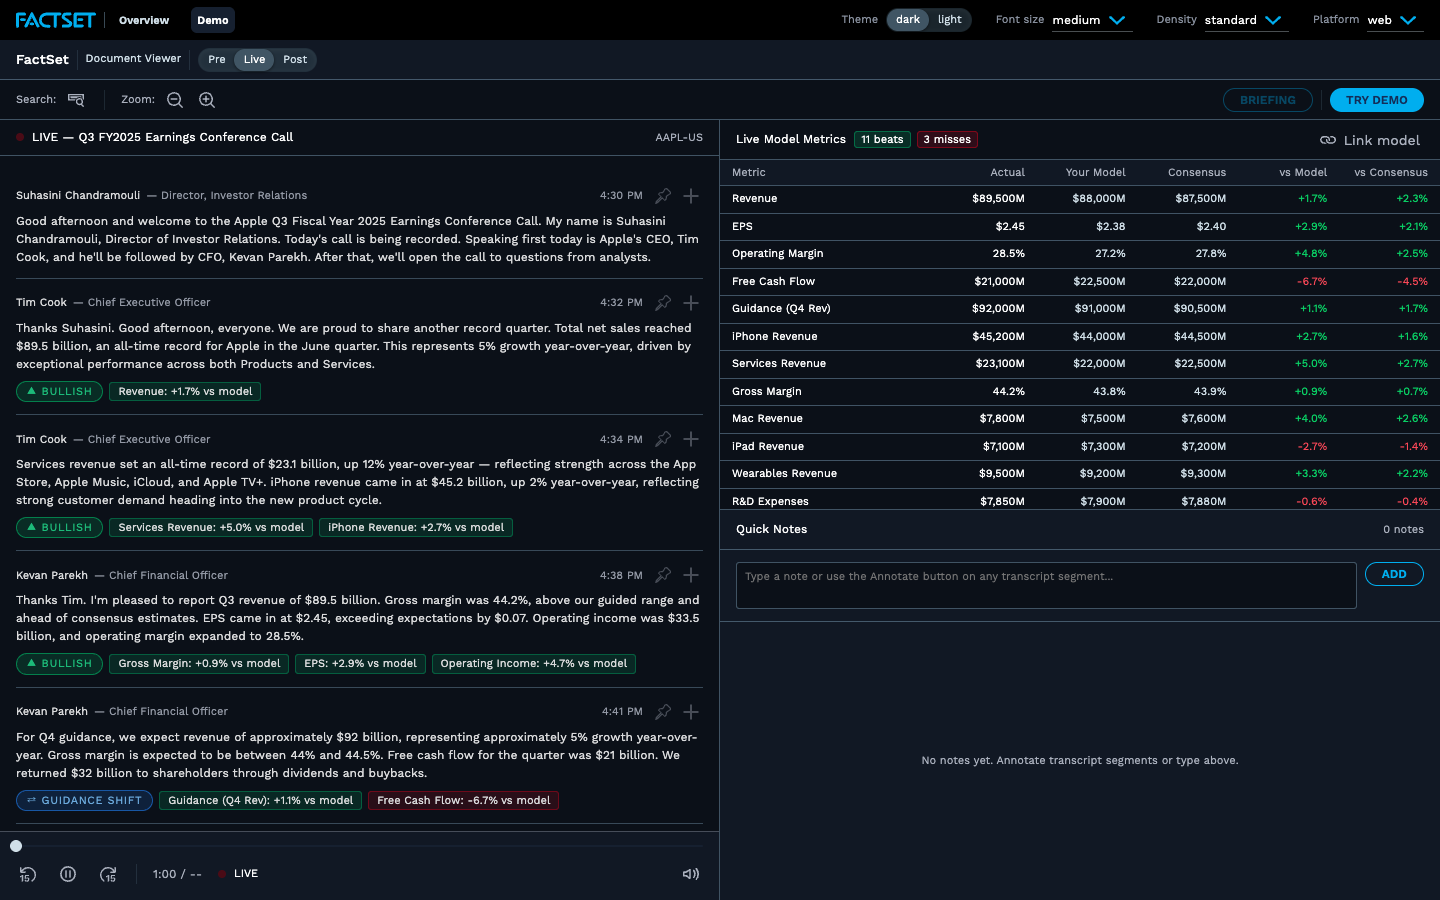
Live transcript with AI highlights, P&L model comparison, management tone signals, and real-time AI commentary tiles updating as the call unfolds.
One-click PM Brief generation — AI synthesises the call into a structured briefing document, ready to send.
Cross-document search across press releases, SEC filings, and transcripts — instantly surfacing comparable data points.
Rather than exposing raw LLM output, I designed structured "AI Tile" components — each tile owns a single analytical lens and presents it in a scannable, actionable format.
Pattern applied: Transparent by Default — every AI tile shows its data source, last updated time, and confidence level. Analysts trust the output because they can verify the input.
The transcript panel was the most interaction-dense area. Key design decisions:
- AI highlights inline: Key statements flagged with coloured indicators — positive signal, risk flag, or model beat/miss
- Speaker diarization: Management vs. analyst questions clearly separated
- Seek-to-audio: Clicking any transcript line jumps the video to that moment
- Persistent scroll state: Panel stays anchored to the user's last read position, not auto-scrolling away
A slide-out panel lets analysts capture their own commentary alongside AI suggestions — then generate a PM brief with one click. The brief is structured (company, setup, actuals, rationale, action) and ready to send.
Key insight from research: Analysts didn't want AI to write the brief — they wanted AI to structure their own words faster. The final design lets analysts confirm, edit, and own the output.
Live earnings view — transcript panel with AI highlights
AI analysis tiles and PM Brief generation
The home dashboard shows the analyst's coverage universe with earnings status — upcoming, live, and recently reported. Key components:
- Top Movers ribbon: Real-time post-earnings price movement across coverage
- Earnings window indicator: Visual cycle tracker showing how many companies have reported vs. pending
- P&L tile: Beat/miss summary with EPS and revenue actuals vs. estimates
- Company cards: Responsive grid with status badges, quick-action buttons, and AI signal badges
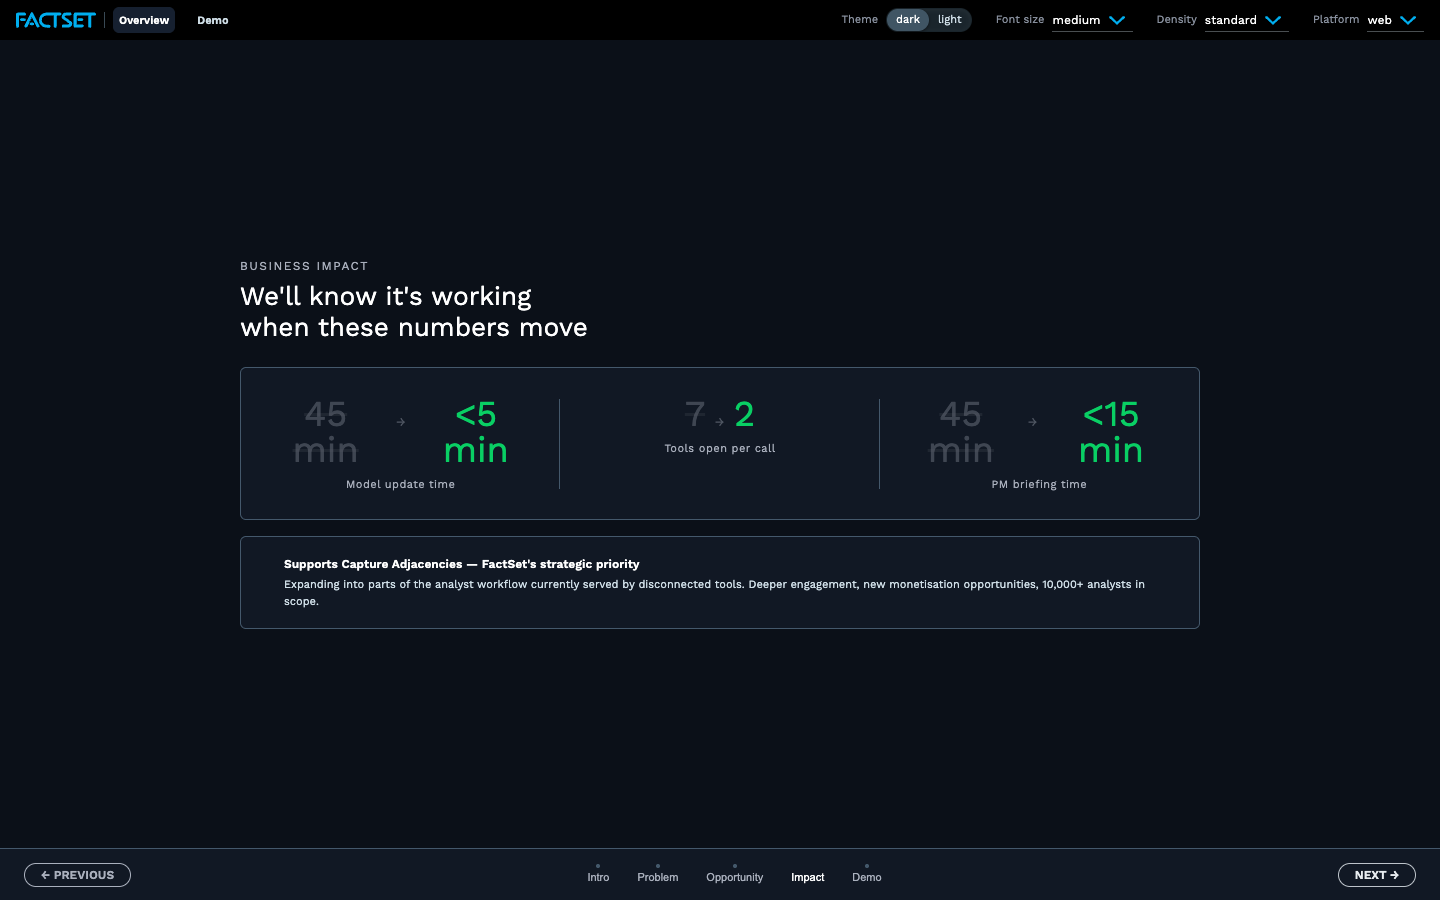
Impact summary — time savings and analyst workflow improvements
- Reduced context-switching: All earnings signals — transcript, AI analysis, model data — in a single surface
- PM brief time cut significantly: Analysts generate and send briefings in under 2 minutes versus 20+ manual
- Stakeholder alignment: Coded prototype drove product and engineering conversations that a static mockup couldn't
- AI trust built in: Transparent sourcing and confidence indicators meant analysts engaged with AI output rather than ignoring it
View Other Projects
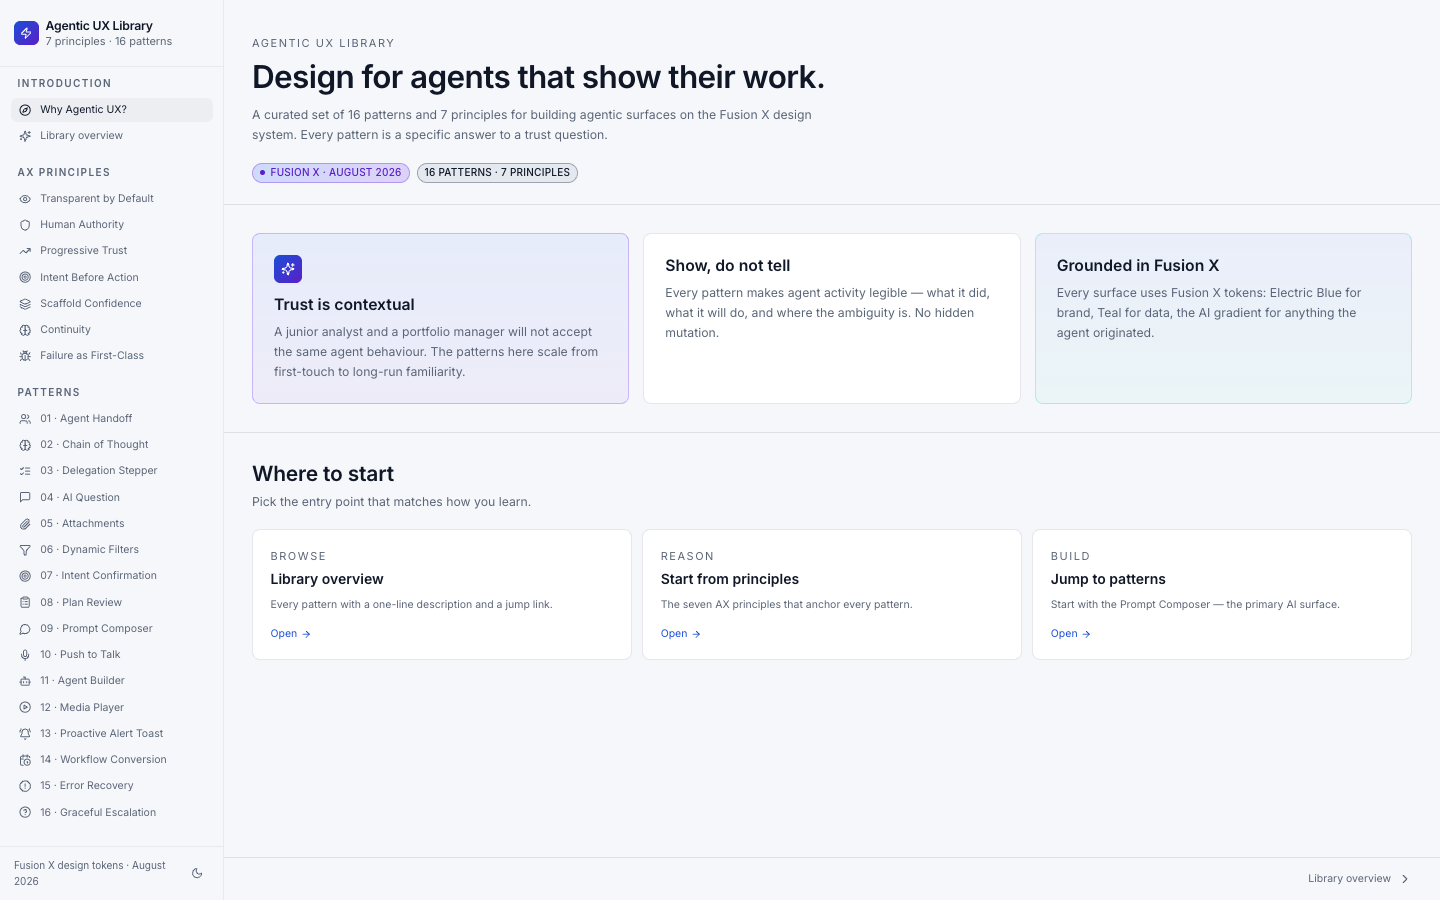
Agentic UX Principles & Patterns
Documented and published a set of design patterns for agentic UX — used as a reference across the UX team.
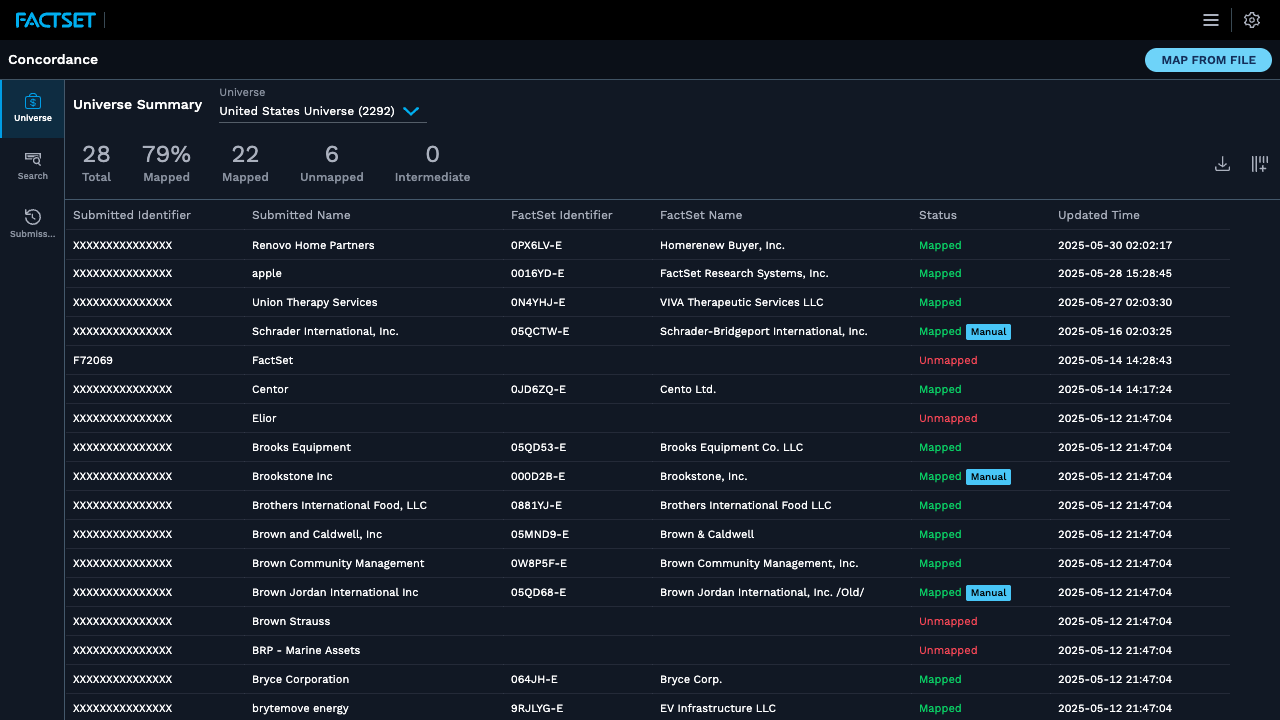
Concordance UX
Redesigned a complex data mapping interface with AI-assisted configuration and streamlined column mapping.